Chart pattern: V Bottom
-
- 0
- 19580
- 0
What is a V bottom?
A V bottom is a V-shaped trough as its name suggests. The trough is very sharp. Investor irrationality leads to a sudden price fall, then a complete retracement of the bearish movement in the aftermath. A V bottom often occurs in a bearish trend and announces a trend reversal. However, it may also form in a bullish trend. A V bottom regularly appears after an economic announcement that has taken investors by surprise. This is a sign of high volatility.
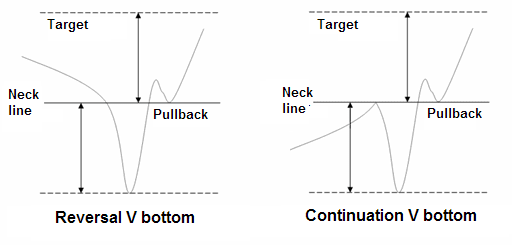
The pattern’s theoretical objective is the distance between the neck line and the lowest part of the V that is plotted on the neck line.
Several criteria make it possible to identify a V bottom:
- The lowest point of the V is often formed by a single candlestick (often with a large low wick, which indicates the investors' desire for a reversal)
- The sudden bearish movement that forms the V is driven by a very steep bearish trend line. The price hardly pauses during the movement.
- The angle of the bullish line leading to the bullish reversal must be almost identical to the angle of the bearish line that led to the bearish movement.
The pattern’s neck line is formed by the highest point preceding the formation of the V.
Graphical representation of a V-bottom
Notes on V bottoms
- It is very difficult to anticipate a V bottom
- The interest in the pattern lies in its potential to reverse the trend
- V-bottoms often appear in a channel
- The bullish movement continues in most cases once the figure is completed, but with the trend.
Trading strategies with V bottoms
The traditional strategy:
Entry: Open a long position at the break of the neck line
Stop loss: The stop loss is placed below the neck line
Objective: Theoretical objective of the pattern
Advantage: The bullish movement very often continues after the break in the neck line
Disadvantage: It is difficult to place a stop loss correctly because the only real last lowest point is the one at the bottom of the V bottom.
The aggressive strategy:
Entry: Open a short position if the angle on the bullish line that drives the bullish movement appears to be identical to the angle of the bearish line that drove the bearish movement
Stop loss: The stop loss is placed under the last lowest one
Objective: Return to the neck line
Advantage: The increase can be very fast.
Disadvantage: The pattern is not yet confirmed and the bullish movement following the V Bottoms low point could be a simple correction.
For your information: A V Bottom is a reversal chart pattern. Its opposite is a V Top.


