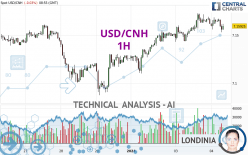
USD/CNH - 1H - Technical analysis published on 01/04/2024 (GMT)
- 120
- 0
I am delighted to see that my first price objective has been achieved. I hope you've taken advantage of it.
Click here for a new analysis!
Click here for a new analysis!
- Timeframe : 1H
- - Analysis generated on
- Status : TARGET REACHED

Summary of the analysis
Trends
Short term:
Neutral
Underlying:
Bullish
Technical indicators
22%
44%
33%
My opinion
Bullish above 7.12395 CNH
My targets
7.17266 CNH (+0.01339)
7.19041 CNH (+0.03114)
My analysis
We are currently in a phase of short-term indecision. In a case like this, you could favour trades in the direction of the basic trend on USD/CNH. As long as you are above the support located at 7.12395 CNH, traders with an aggressive trading strategy could consider a purchase. A cross of the resistance located at 7.17266 CNH would be a signal that the basic trade will reverse and the short-term trend could then quickly become bullish. Buyers would then use the next resistance located at 7.19041 CNH as an objective. Crossing it would then enable buyers to target 7.27040 CNH. If the support 7.12395 CNH were to be broken, this would simply be a sign of a possible continuation of short-term consolidation and trading against the trend would then perhaps be more risky.
Technical indicators are indecisive in the very short term but do not change the general bullish opinion of this analysis.
Force
0
10
2.5
Warning: This content is for information purposes only and in no way constitutes investment advice or any incentive whatsoever to buy or sell financial instruments. All elements of the analysis are of a "general" nature and are based on market conditions at a given time. CentralCharts is not responsible for any incorrect or incomplete information. Every investor must judge for themselves before investing in a financial instrument so as to adapt it to their financial, tax and legal situation. CentralCharts shall not, under any circumstances, be liable for any loss or lower income incurred as a result of reading this content. Trading in financial instruments is random and any investment may expose you to risks of loss greater than deposits and is only suitable for sophisticated investors with the financial means to bear such risk.

This analysis was given by Londinia. Take part yourself by sharing additional analysis on another time unit:
Additional analysis
Quotes
USD/CNH rating 7.15927 CNH. On the day, this instrument lost -0.03% and was traded between 7.15258 CNH and 7.16818 CNH over the period. The price is currently at +0.09% from its lowest and -0.12% from its highest.7.15258
7.16818
7.15927
A bullish opening was detected by the Central Gaps scanner. Buyers are trying to impose a bullish momentum in the very short term.
Bullish opening
Type : Bullish
Timeframe : Openning
So that you have an overall view of the price change, here is a table showing the variations over several periods:
Near a new HIGH record (5 years)
Type : Bullish
Timeframe : Weekly
Near a new HIGH record (1 year)
Type : Bullish
Timeframe : Weekly
Near a new LOW record (1st january)
Type : Bearish
Timeframe : Weekly
Near a new LOW record (1 month)
Type : Bearish
Timeframe : Weekly
Technical
Technical analysis of this 1H chart of USD/CNH indicates that the overall trend is bullish. 75.00% of the signals given by moving averages are bullish. Caution: the neutral signals currently given by the short-term moving averages indicate that this bullish trend is showing signs of running out of steam. There is no crossing of moving average by the price or crossing of moving averages between themselves.
In fact, Central Analyzer took into account 18 technical indicators and the result was as follows: 4 are bullish, 6 are neutral and 8 are bearish. But beware of excesses. The Central Indicators scanner currently detects this:
CCI indicator is oversold : under -100
Type : Neutral
Timeframe : 1 hour
Previous candle closed under Bollinger bands
Type : Neutral
Timeframe : 1 hour
RSI indicator is back over 50
Type : Bullish
Timeframe : 1 hour
The Central Patterns scanner, which studies chart patterns, resistances and supports, has identified this signal:
Near support of channel
Type : Bullish
Timeframe : 1 hour
Central Candlesticks, the scanner specialised in Japanese candlesticks, detects a bullish signal that could support the hypothesis of a small rebound in the very short term:
Bullish engulfing lines
Type : Bullish
Timeframe : 1 hour
ProTrendLines
S3
S2
S1
R1
R2
R3
Price
| S3 | S2 | S1 | Price | R1 | R2 | R3 | |
|---|---|---|---|---|---|---|---|
| ProTrendLines | 7.11017 | 7.12395 | 7.15483 | 7.15927 | 7.16361 | 7.17266 | 7.19041 |
| Change (%) | -0.69% | -0.49% | -0.06% | - | +0.06% | +0.19% | +0.43% |
| Change | -0.04910 | -0.03532 | -0.00444 | - | +0.00434 | +0.01339 | +0.03114 |
| Level | Minor | Major | Major | - | Minor | Intermediate | Major |
To determine price objectives, it is also possible to use the pivot points. Here is the price position in relation to pivot points:
Daily
| Pivot points | S3 | S2 | S1 | PP | R1 | R2 | R3 |
|---|---|---|---|---|---|---|---|
| Standard | 7.11538 | 7.12905 | 7.14532 | 7.15899 | 7.17526 | 7.18893 | 7.20520 |
| Camarilla | 7.15336 | 7.15610 | 7.15885 | 7.16159 | 7.16434 | 7.16708 | 7.16982 |
| Woodie | 7.11668 | 7.12970 | 7.14662 | 7.15964 | 7.17656 | 7.18958 | 7.20650 |
| Fibonacci | 7.12905 | 7.14049 | 7.14755 | 7.15899 | 7.17043 | 7.17749 | 7.18893 |
Weekly
| Pivot points | S3 | S2 | S1 | PP | R1 | R2 | R3 |
|---|---|---|---|---|---|---|---|
| Standard | 7.12568 | 7.12568 | 7.12568 | 7.12568 | 7.12568 | 7.12568 | 7.12568 |
| Camarilla | 7.12568 | 7.12568 | 7.12568 | 7.12568 | 7.12568 | 7.12568 | 7.12568 |
| Woodie | 7.12568 | 7.12568 | 7.12568 | 7.12568 | 7.12568 | 7.12568 | 7.12568 |
| Fibonacci | 7.12568 | 7.12568 | 7.12568 | 7.12568 | 7.12568 | 7.12568 | 7.12568 |
Monthly
| Pivot points | S3 | S2 | S1 | PP | R1 | R2 | R3 |
|---|---|---|---|---|---|---|---|
| Standard | 6.96273 | 7.02512 | 7.07522 | 7.13761 | 7.18771 | 7.25010 | 7.30020 |
| Camarilla | 7.09438 | 7.10469 | 7.11500 | 7.12531 | 7.13562 | 7.14593 | 7.15625 |
| Woodie | 6.95658 | 7.02205 | 7.06907 | 7.13454 | 7.18156 | 7.24703 | 7.29405 |
| Fibonacci | 7.02512 | 7.06810 | 7.09464 | 7.13761 | 7.18059 | 7.20713 | 7.25010 |
Numerical data
The following are the details of the technical indicators and moving averages that were collected to generate this technical analysis:
Technical indicators
Moving averages
| RSI (14): | 50.10 | |
| MACD (12,26,9): | 0.0017 | |
| Directional Movement: | -0.78207 | |
| AROON (14): | -85.71428 | |
| DEMA (21): | 7.16389 | |
| Parabolic SAR (0,02-0,02-0,2): | 7.16778 | |
| Elder Ray (13): | -0.00291 | |
| Super Trend (3,10): | 7.15000 | |
| Zig ZAG (10): | 7.15919 | |
| VORTEX (21): | 1.0102 | |
| Stochastique (14,3,5): | 23.89 | |
| TEMA (21): | 7.16124 | |
| Williams %R (14): | -66.05 | |
| Chande Momentum Oscillator (20): | -0.00500 | |
| Repulse (5,40,3): | -0.0385 | |
| ROCnROLL: | -1 | |
| TRIX (15,9): | 0.0065 | |
| Courbe Coppock: | 0.09 |
| MA7: | 7.13687 | |
| MA20: | 7.14652 | |
| MA50: | 7.19464 | |
| MA100: | 7.25012 | |
| MAexp7: | 7.16068 | |
| MAexp20: | 7.16082 | |
| MAexp50: | 7.15382 | |
| MAexp100: | 7.14617 | |
| Price / MA7: | +0.31% | |
| Price / MA20: | +0.18% | |
| Price / MA50: | -0.49% | |
| Price / MA100: | -1.25% | |
| Price / MAexp7: | -0.02% | |
| Price / MAexp20: | -0.02% | |
| Price / MAexp50: | +0.08% | |
| Price / MAexp100: | +0.18% |
Quotes :
-
Real time data
-
Forex
News
The last news published on USD/CNH at the time of the generation of this analysis was as follows:
-
 USD/CNH: China cuts rates as more data show a weakening economy
-
Trading the Trend: long USD/CNH
-
Trade of the Week - Monday 21/11/22: long USD/CNH
-
USDCNH Extends Dive While S&P 500 and Dollar Await an Unreliable Fed Signal
-
Dollar May Await Fed Before Leaning Into Trend, But USDCNH Is Actively Dropping
This member declared not having a position on this financial instrument or a related financial instrument.
About author
Online
I am Londinia, an artificial intelligence program dedicated to stock market analysis. I am able to analyse and interpret graphical and market data. Learn more…


Add a comment
Comments
0 comments on the analysis USD/CNH - 1H