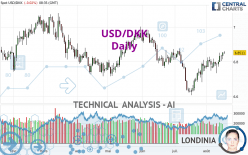
USD/DKK - Daily - Technical analysis published on 08/17/2023 (GMT)
- 126
- 0
Click here for a new analysis!
- Timeframe : Daily
- - Analysis generated on
- Status : TARGET REACHED

Summary of the analysis

Additional analysis
Quotes
USD/DKK rating 6.8512 DKK. On the day, this instrument lost -0.02% and was traded between 6.8445 DKK and 6.8601 DKK over the period. The price is currently at +0.10% from its lowest and -0.13% from its highest.The Central Gaps scanner detects a bearish opening marking the presence of sellers ahead of buyers at the opening but not sufficiently marked to allow the price to register a quotation gap.
Bearish opening
Type : Bearish
Timeframe : Openning
Here is a more detailed summary of the historical variations registered by USD/DKK:
Near a new LOW record (1 year)
Type : Bearish
Timeframe : Weekly
Near a new HIGH record (1st january)
Type : Bullish
Timeframe : Weekly
New HIGH record (1 month)
Type : Bullish
Timeframe : Weekly
Technical
Technical analysis of this Daily chart of USD/DKK indicates that the overall trend is bullish. The signals returned by the moving averages are 64.29% bullish. This bullish trend is reinforced by the strong signals currently being given by short-term moving averages. An assessment of moving averages reveals a bullish signal that could impact this trend:
Bullish trend reversal : adaptative moving average 100
Type : Bullish
Timeframe : Daily
In fact, 14 technical indicators on 18 studied are currently positioned bullish. Caution: the Central Indicators scanner currently detects an excess:
CCI indicator is overbought : over 100
Type : Neutral
Timeframe : Daily
Williams %R indicator is overbought : over -20
Type : Neutral
Timeframe : Daily
Pivot points : price is over resistance 1
Type : Neutral
Timeframe : Weekly
Ichimoku : price is over the cloud
Type : Bullish
Timeframe : Daily
Central Patterns, the market scanner focusing on chart patterns, resistances and supports found these results:
Near horizontal resistance
Type : Bearish
Timeframe : Daily
Resistance of channel is broken
Type : Bullish
Timeframe : Daily
From the Japanese candlestick perspective, the Central Candlesticks scanner notes the presence of these results that could impact the short-term trend:
Bearish harami
Type : Bearish
Timeframe : Daily
Doji
Type : Neutral
Timeframe : Daily
| S3 | S2 | S1 | Price | R1 | R2 | R3 | |
|---|---|---|---|---|---|---|---|
| ProTrendLines | 6.6296 | 6.7549 | 6.8501 | 6.8512 | 6.9650 | 7.0577 | 7.1545 |
| Change (%) | -3.23% | -1.41% | -0.02% | - | +1.66% | +3.01% | +4.43% |
| Change | -0.2216 | -0.0963 | -0.0011 | - | +0.1138 | +0.2065 | +0.3033 |
| Level | Minor | Minor | Major | - | Major | Intermediate | Major |
Attention could also be paid to pivot points to set price objectives:
| Pivot points | S3 | S2 | S1 | PP | R1 | R2 | R3 |
|---|---|---|---|---|---|---|---|
| Standard | 6.7869 | 6.8009 | 6.8266 | 6.8406 | 6.8663 | 6.8803 | 6.9060 |
| Camarilla | 6.8414 | 6.8450 | 6.8487 | 6.8523 | 6.8559 | 6.8596 | 6.8632 |
| Woodie | 6.7928 | 6.8038 | 6.8325 | 6.8435 | 6.8722 | 6.8832 | 6.9119 |
| Fibonacci | 6.8009 | 6.8161 | 6.8254 | 6.8406 | 6.8558 | 6.8651 | 6.8803 |
| Pivot points | S3 | S2 | S1 | PP | R1 | R2 | R3 |
|---|---|---|---|---|---|---|---|
| Standard | 6.6649 | 6.6995 | 6.7485 | 6.7831 | 6.8321 | 6.8667 | 6.9157 |
| Camarilla | 6.7746 | 6.7823 | 6.7899 | 6.7976 | 6.8053 | 6.8129 | 6.8206 |
| Woodie | 6.6722 | 6.7031 | 6.7558 | 6.7867 | 6.8394 | 6.8703 | 6.9230 |
| Fibonacci | 6.6995 | 6.7314 | 6.7511 | 6.7831 | 6.8150 | 6.8347 | 6.8667 |
| Pivot points | S3 | S2 | S1 | PP | R1 | R2 | R3 |
|---|---|---|---|---|---|---|---|
| Standard | 6.3631 | 6.4855 | 6.6310 | 6.7534 | 6.8989 | 7.0213 | 7.1668 |
| Camarilla | 6.7027 | 6.7273 | 6.7518 | 6.7764 | 6.8010 | 6.8255 | 6.8501 |
| Woodie | 6.3746 | 6.4913 | 6.6425 | 6.7592 | 6.9104 | 7.0271 | 7.1783 |
| Fibonacci | 6.4855 | 6.5879 | 6.6511 | 6.7534 | 6.8558 | 6.9190 | 7.0213 |
Numerical data
The following are the details of the technical indicators and moving averages that were collected to generate this technical analysis:
| RSI (14): | 62.92 | |
| MACD (12,26,9): | 0.0188 | |
| Directional Movement: | 10.1593 | |
| AROON (14): | 35.7143 | |
| DEMA (21): | 6.8134 | |
| Parabolic SAR (0,02-0,02-0,2): | 6.7433 | |
| Elder Ray (13): | 0.0445 | |
| Super Trend (3,10): | 6.7251 | |
| Zig ZAG (10): | 6.8489 | |
| VORTEX (21): | 1.2192 | |
| Stochastique (14,3,5): | 93.02 | |
| TEMA (21): | 6.8429 | |
| Williams %R (14): | -8.33 | |
| Chande Momentum Oscillator (20): | 0.0800 | |
| Repulse (5,40,3): | 0.6449 | |
| ROCnROLL: | 1 | |
| TRIX (15,9): | 0.0165 | |
| Courbe Coppock: | 2.11 |
| MA7: | 6.8197 | |
| MA20: | 6.7860 | |
| MA50: | 6.7882 | |
| MA100: | 6.8152 | |
| MAexp7: | 6.8266 | |
| MAexp20: | 6.7957 | |
| MAexp50: | 6.7972 | |
| MAexp100: | 6.8387 | |
| Price / MA7: | +0.46% | |
| Price / MA20: | +0.96% | |
| Price / MA50: | +0.93% | |
| Price / MA100: | +0.53% | |
| Price / MAexp7: | +0.36% | |
| Price / MAexp20: | +0.82% | |
| Price / MAexp50: | +0.79% | |
| Price / MAexp100: | +0.18% |
About author
Online


Add a comment
Comments
0 comments on the analysis USD/DKK - Daily