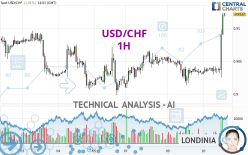
USD/CHF - 1H - Technical analysis published on 04/10/2024 (GMT)
- 120
- 0
Click here for a new analysis!
- Timeframe : 1H
- - Analysis generated on
- Status : LEVEL MAINTAINED

Summary of the analysis

Additional analysis
Quotes
The USD/CHF price is 0.9122 CHF. On the day, this instrument gained +1.01% and was between 0.9025 CHF and 0.9123 CHF. This implies that the price is at +1.07% from its lowest and at -0.01% from its highest.A study of price movements over other periods shows the following variations:
Near a new HIGH record (1 year)
Type : Bullish
Timeframe : Weekly
New HIGH record (1st january)
Type : Bullish
Timeframe : Weekly
New HIGH record (1 month)
Type : Bullish
Timeframe : Weekly
Technical
A technical analysis in 1H of this USD/CHF chart shows a strongly bullish trend. 89.29% of the signals given by moving averages are bullish. This strongly bullish trend is supported by the strong bullish signals given by short-term moving averages. An assessment of moving averages reveals several bullish signals that could impact this trend:
Bullish trend reversal : Moving Average 50
Type : Bullish
Timeframe : 1 hour
Bullish trend reversal : Moving Average 100
Type : Bullish
Timeframe : 1 hour
Bullish trend reversal : adaptative moving average 50
Type : Bullish
Timeframe : 1 hour
Bullish trend reversal : adaptative moving average 100
Type : Bullish
Timeframe : 1 hour
The probability of a further increase is high given the direction of the technical indicators.
Caution: the Central Indicators scanner currently detects an excess:
RSI indicator is overbought : over 80
Type : Neutral
Timeframe : 1 hour
CCI indicator is overbought : over 100
Type : Neutral
Timeframe : 1 hour
Previous candle closed over Bollinger bands
Type : Neutral
Timeframe : 1 hour
Williams %R indicator is overbought : over -20
Type : Neutral
Timeframe : 1 hour
Pivot points : price is over resistance 1
Type : Neutral
Timeframe : Weekly
Pivot points : price is over resistance 3
Type : Neutral
Timeframe : 1 hour
An analysis of the price chart with the Central Patterns scanner (detector of chart patterns and resistances and supports) shows a result that can have an impact on the price change:
Near resistance of triangle
Type : Bearish
Timeframe : 1 hour
The Central Candlesticks scanner which studies Japanese candlesticks did not detect anything.
| S3 | S2 | S1 | Price | R1 | R2 | R3 | |
|---|---|---|---|---|---|---|---|
| ProTrendLines | 0.9066 | 0.9075 | 0.9100 | 0.9122 | 0.9221 | 0.9434 | 1.0175 |
| Change (%) | -0.61% | -0.52% | -0.24% | - | +1.09% | +3.42% | +11.54% |
| Change | -0.0056 | -0.0047 | -0.0022 | - | +0.0099 | +0.0312 | +0.1053 |
| Level | Intermediate | Intermediate | Intermediate | - | Major | Intermediate | Major |
Attention could also be paid to pivot points to set price objectives:
| Pivot points | S3 | S2 | S1 | PP | R1 | R2 | R3 |
|---|---|---|---|---|---|---|---|
| Standard | 0.8966 | 0.8990 | 0.9010 | 0.9034 | 0.9054 | 0.9078 | 0.9098 |
| Camarilla | 0.9019 | 0.9023 | 0.9027 | 0.9031 | 0.9035 | 0.9039 | 0.9043 |
| Woodie | 0.8965 | 0.8989 | 0.9009 | 0.9033 | 0.9053 | 0.9077 | 0.9097 |
| Fibonacci | 0.8990 | 0.9007 | 0.9017 | 0.9034 | 0.9051 | 0.9061 | 0.9078 |
| Pivot points | S3 | S2 | S1 | PP | R1 | R2 | R3 |
|---|---|---|---|---|---|---|---|
| Standard | 0.8879 | 0.8939 | 0.8977 | 0.9037 | 0.9075 | 0.9135 | 0.9173 |
| Camarilla | 0.8989 | 0.8998 | 0.9007 | 0.9016 | 0.9025 | 0.9034 | 0.9043 |
| Woodie | 0.8869 | 0.8934 | 0.8967 | 0.9032 | 0.9065 | 0.9130 | 0.9163 |
| Fibonacci | 0.8939 | 0.8976 | 0.8999 | 0.9037 | 0.9074 | 0.9097 | 0.9135 |
| Pivot points | S3 | S2 | S1 | PP | R1 | R2 | R3 |
|---|---|---|---|---|---|---|---|
| Standard | 0.8462 | 0.8595 | 0.8805 | 0.8938 | 0.9148 | 0.9281 | 0.9491 |
| Camarilla | 0.8920 | 0.8951 | 0.8983 | 0.9014 | 0.9045 | 0.9077 | 0.9108 |
| Woodie | 0.8500 | 0.8614 | 0.8843 | 0.8957 | 0.9186 | 0.9300 | 0.9529 |
| Fibonacci | 0.8595 | 0.8726 | 0.8807 | 0.8938 | 0.9069 | 0.9150 | 0.9281 |
Numerical data
The following is the status of technical indicators and moving averages registered at the time this technical analysis was created:
| RSI (14): | 85.05 | |
| MACD (12,26,9): | 0.0009 | |
| Directional Movement: | 36.7828 | |
| AROON (14): | 7.1429 | |
| DEMA (21): | 0.9058 | |
| Parabolic SAR (0,02-0,02-0,2): | 0.9025 | |
| Elder Ray (13): | 0.0051 | |
| Super Trend (3,10): | 0.9058 | |
| Zig ZAG (10): | 0.9119 | |
| VORTEX (21): | 1.2652 | |
| Stochastique (14,3,5): | 78.32 | |
| TEMA (21): | 0.9068 | |
| Williams %R (14): | -2.04 | |
| Chande Momentum Oscillator (20): | 0.0083 | |
| Repulse (5,40,3): | 0.9878 | |
| ROCnROLL: | 1 | |
| TRIX (15,9): | 0.0019 | |
| Courbe Coppock: | 0.60 |
| MA7: | 0.9048 | |
| MA20: | 0.8987 | |
| MA50: | 0.8864 | |
| MA100: | 0.8755 | |
| MAexp7: | 0.9067 | |
| MAexp20: | 0.9049 | |
| MAexp50: | 0.9044 | |
| MAexp100: | 0.9043 | |
| Price / MA7: | +0.82% | |
| Price / MA20: | +1.50% | |
| Price / MA50: | +2.91% | |
| Price / MA100: | +4.19% | |
| Price / MAexp7: | +0.61% | |
| Price / MAexp20: | +0.81% | |
| Price / MAexp50: | +0.86% | |
| Price / MAexp100: | +0.87% |
News
The latest news and videos published on USD/CHF at the time of the analysis were as follows:
-
 USD/CHF Forecast March 20, 2024
-
USD/CHF Forecast March 19, 2024
-
Technical Analysis: 20/02/2024 - USDCHF regains some power, but is still at risk
-
USD/CHF Forecast February 16, 2024
-
USD/CHF Forecast February 15, 2024
About author

Online


Add a comment
Comments
0 comments on the analysis USD/CHF - 1H