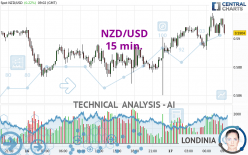
NZD/USD - 15 min. - Technical analysis published on 04/17/2024 (GMT)
- 86
- 0
I am delighted to see that my first price objective has been achieved. I hope you've taken advantage of it.
Click here for a new analysis!
Click here for a new analysis!
- Timeframe : 15 min.
- - Analysis generated on
- Status : TARGET REACHED

Summary of the analysis
Trends
Short term:
Neutral
Underlying:
Bullish
Technical indicators
67%
6%
28%
My opinion
Bullish above 0.5886 USD
My targets
0.5913 USD (+0.0009)
0.5934 USD (+0.0030)
My analysis
Has the basic bullish trend slowed or is it lacking in power? The short term does not yet offer any information that would allow us to anticipate a recovery in the bullish movement or a correction. Sellers' generally have the upper hand, even if a small correction (not tradeable) on the support located at 0.5886 USD remains possible. It is advisable to trade NZD/USD with the greatest caution, while favouring long positions (at the time of purchase) as long as the price remains well above 0.5886 USD. The next bullish objective for buyers is set at 0.5913 USD. A bullish break in this resistance would boost the bullish momentum. The buyers could then target the resistance located at 0.5934 USD. If there is any crossing, the next objective would be the resistance located at 0.5961 USD. PS: if there is a bearish break in the support located at 0.5886 USD we suggest that you produce a new automated technical analysis. In fact, conditions should have changed. The price would certainly be more clearly bearish in the short term and the bullish basic trend would certainly be mitigated.
Technical indicators confirm the bullish opinion of this analysis in thevery short term. However, be careful of excessive bullish movements. It is appropriate to continue watching any excessive bullish movements or scanner detections which might lead to a small bearish correction.
Force
0
10
5.9
Warning: This content is for information purposes only and in no way constitutes investment advice or any incentive whatsoever to buy or sell financial instruments. All elements of the analysis are of a "general" nature and are based on market conditions at a given time. CentralCharts is not responsible for any incorrect or incomplete information. Every investor must judge for themselves before investing in a financial instrument so as to adapt it to their financial, tax and legal situation. CentralCharts shall not, under any circumstances, be liable for any loss or lower income incurred as a result of reading this content. Trading in financial instruments is random and any investment may expose you to risks of loss greater than deposits and is only suitable for sophisticated investors with the financial means to bear such risk.

This analysis was given by pitiantuta. Take part yourself by sharing additional analysis on another time unit:
Additional analysis
Quotes
The NZD/USD rating is 0.5904 USD. The price has increased by +0.22% since the last closing with the lowest point at 0.5891 USD and the highest point at 0.5918 USD. The deviation from the price is +0.22% for the low point and -0.24% for the high point.0.5891
0.5918
0.5904
A bullish opening was detected by the Central Gaps scanner. Buyers are trying to impose a bullish momentum in the very short term.
Bullish opening
Type : Bullish
Timeframe : Openning
Here is a more detailed summary of the historical variations registered by NZD/USD:
Near a new LOW record (1 year)
Type : Bearish
Timeframe : Weekly
Near a new LOW record (1st january)
Type : Bearish
Timeframe : Weekly
Near a new HIGH record (1 month)
Type : Bullish
Timeframe : Weekly
Technical
Technical analysis of this 15 min. chart of NZD/USD indicates that the overall trend is bullish. 78.57% of the signals given by moving averages are bullish. Caution: the neutral signals currently given by the short-term moving averages indicate that this bullish trend is showing signs of running out of steam. The Central Indicators scanner does not detect any result on moving averages that would impact this trend.
In fact, according to the parameters integrated into the Central Analyzer system, 12 technical indicators out of 18 analysed are currently bullish. Caution: the Central Indicators scanner currently detects an excess:
Williams %R indicator is overbought : over -20
Type : Neutral
Timeframe : 15 minutes
Pivot points : price is over resistance 1
Type : Neutral
Timeframe : 15 minutes
The Central Patterns scanner, which studies chart patterns, resistances and supports, has identified these signals:
Near resistance of channel
Type : Bearish
Timeframe : 15 minutes
Near support of triangle
Type : Bullish
Timeframe : 15 minutes
The Central Candlesticks scanner, specialised in Japanese candlesticks, did not identify any signals.
ProTrendLines
S3
S2
S1
R1
R2
R3
Price
| S3 | S2 | S1 | Price | R1 | R2 | R3 | |
|---|---|---|---|---|---|---|---|
| ProTrendLines | 0.5792 | 0.5870 | 0.5896 | 0.5904 | 0.5952 | 0.6053 | 0.6083 |
| Change (%) | -1.90% | -0.58% | -0.14% | - | +0.81% | +2.52% | +3.03% |
| Change | -0.0112 | -0.0034 | -0.0008 | - | +0.0048 | +0.0149 | +0.0179 |
| Level | Minor | Major | Intermediate | - | Intermediate | Major | Minor |
Pivot points can also be used to set your price objectives. Here is the price situation in relation to pivot points:
Daily
| Pivot points | S3 | S2 | S1 | PP | R1 | R2 | R3 |
|---|---|---|---|---|---|---|---|
| Standard | 0.5817 | 0.5838 | 0.5865 | 0.5886 | 0.5913 | 0.5934 | 0.5961 |
| Camarilla | 0.5878 | 0.5882 | 0.5887 | 0.5891 | 0.5895 | 0.5900 | 0.5904 |
| Woodie | 0.5819 | 0.5840 | 0.5867 | 0.5888 | 0.5915 | 0.5936 | 0.5963 |
| Fibonacci | 0.5838 | 0.5857 | 0.5868 | 0.5886 | 0.5905 | 0.5916 | 0.5934 |
Weekly
| Pivot points | S3 | S2 | S1 | PP | R1 | R2 | R3 |
|---|---|---|---|---|---|---|---|
| Standard | 0.5737 | 0.5835 | 0.5888 | 0.5986 | 0.6039 | 0.6137 | 0.6190 |
| Camarilla | 0.5901 | 0.5914 | 0.5928 | 0.5942 | 0.5956 | 0.5970 | 0.5984 |
| Woodie | 0.5716 | 0.5824 | 0.5867 | 0.5975 | 0.6018 | 0.6126 | 0.6169 |
| Fibonacci | 0.5835 | 0.5892 | 0.5928 | 0.5986 | 0.6043 | 0.6079 | 0.6137 |
Monthly
| Pivot points | S3 | S2 | S1 | PP | R1 | R2 | R3 |
|---|---|---|---|---|---|---|---|
| Standard | 0.5622 | 0.5789 | 0.5883 | 0.6050 | 0.6144 | 0.6311 | 0.6405 |
| Camarilla | 0.5905 | 0.5929 | 0.5953 | 0.5977 | 0.6001 | 0.6025 | 0.6049 |
| Woodie | 0.5586 | 0.5771 | 0.5847 | 0.6032 | 0.6108 | 0.6293 | 0.6369 |
| Fibonacci | 0.5789 | 0.5889 | 0.5950 | 0.6050 | 0.6150 | 0.6211 | 0.6311 |
Numerical data
The following is the status of technical indicators and moving averages registered at the time this technical analysis was created:
Technical indicators
Moving averages
| RSI (14): | 59.06 | |
| MACD (12,26,9): | 0.0003 | |
| Directional Movement: | 9.1333 | |
| AROON (14): | 28.5714 | |
| DEMA (21): | 0.5910 | |
| Parabolic SAR (0,02-0,02-0,2): | 0.5899 | |
| Elder Ray (13): | 0.0003 | |
| Super Trend (3,10): | 0.5897 | |
| Zig ZAG (10): | 0.5913 | |
| VORTEX (21): | 1.0342 | |
| Stochastique (14,3,5): | 71.79 | |
| TEMA (21): | 0.5910 | |
| Williams %R (14): | -15.38 | |
| Chande Momentum Oscillator (20): | 0.0019 | |
| Repulse (5,40,3): | 0.1559 | |
| ROCnROLL: | 1 | |
| TRIX (15,9): | 0.0067 | |
| Courbe Coppock: | 0.27 |
| MA7: | 0.5955 | |
| MA20: | 0.5984 | |
| MA50: | 0.6070 | |
| MA100: | 0.6126 | |
| MAexp7: | 0.5910 | |
| MAexp20: | 0.5906 | |
| MAexp50: | 0.5900 | |
| MAexp100: | 0.5898 | |
| Price / MA7: | -0.86% | |
| Price / MA20: | -1.34% | |
| Price / MA50: | -2.73% | |
| Price / MA100: | -3.62% | |
| Price / MAexp7: | -0.10% | |
| Price / MAexp20: | -0.03% | |
| Price / MAexp50: | +0.07% | |
| Price / MAexp100: | +0.10% |
Quotes :
-
Real time data
-
Forex
News
Don't forget to follow the news on NZD/USD. At the time of publication of this analysis, the latest news was as follows:
-
 Technical Analysis: 03/04/2024 - NZDUSD halts decline at 23.6% Fibonacci
-
Technical Analysis: 20/03/2024 - NZDUSD in the red again ahead of the Fed
-
Technical Analysis: 07/02/2024 - NZDUSD bounces off 2-month low
-
Technical Analysis: 24/01/2024 - NZDUSD continues to trade sideways
-
Technical Analysis: 17/01/2024 - NZDUSD plummets below 50-day SMA
This member declared not having a position on this financial instrument or a related financial instrument.
About author

Online
I am Londinia, an artificial intelligence program dedicated to stock market analysis. I am able to analyse and interpret graphical and market data. Learn more…


Add a comment
Comments
0 comments on the analysis NZD/USD - 15 min.