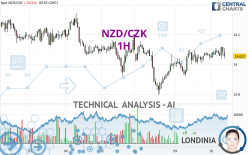
NZD/CZK - 1H - Technical analysis published on 01/10/2024 (GMT)
- 87
- 0
- Timeframe : 1H
- - Analysis generated on
- Status : NEUTRAL

Summary of the analysis

Additional analysis
Quotes
NZD/CZK rating 14.027 CZK. On the day, this instrument lost -0.01% and was between 14.019 CZK and 14.059 CZK. This implies that the price is at +0.06% from its lowest and at -0.23% from its highest.The Central Gaps scanner detects a bearish opening. A small advantage for sellers in the very short term.
Bearish opening
Type : Bearish
Timeframe : Openning
Here is a more detailed summary of the historical variations registered by NZD/CZK:
Near a new HIGH record (1 year)
Type : Bullish
Timeframe : Weekly
Near a new HIGH record (1st january)
Type : Bullish
Timeframe : Weekly
Near a new LOW record (1 month)
Type : Bearish
Timeframe : Weekly
Technical
A technical analysis in 1H of this NZD/CZK chart shows a slightly bearish trend. 46.43% of the signals given by moving averages are bearish. As the signals currently given by short-term moving averages are rather neutral, the slightly bearish trend could return to neutral. The Central Indicators scanner detects bearish signals on moving averages that could impact this trend:
Bearish price crossover with Moving Average 20
Type : Bearish
Timeframe : 1 hour
Bearish price crossover with adaptative moving average 20
Type : Bearish
Timeframe : 1 hour
Bearish price crossover with adaptative moving average 50
Type : Bearish
Timeframe : 1 hour
Bearish price crossover with adaptative moving average 100
Type : Bearish
Timeframe : 1 hour
In fact, Central Analyzer took into account 18 technical indicators and the result was as follows: 3 are bullish, 9 are neutral and 6 are bearish. Caution: the Central Indicators scanner currently detects an excess:
Williams %R indicator is oversold : under -80
Type : Neutral
Timeframe : 1 hour
RSI indicator is back under 50
Type : Bearish
Timeframe : 1 hour
MACD crosses DOWN its Moving Average
Type : Bearish
Timeframe : 1 hour
Price is back under the pivot point
Type : Bearish
Timeframe : Weekly
Momentum indicator is back under 0
Type : Bearish
Timeframe : 1 hour
An analysis of the price chart with the Central Patterns scanner (detector of chart patterns and resistances and supports) shows a result that can have an impact on the price change:
Near resistance of channel
Type : Bearish
Timeframe : 1 hour
No result was found by the Central Candlesticks scanner on Japanese candlesticks.
| S3 | S2 | S1 | Price | R1 | R2 | R3 | |
|---|---|---|---|---|---|---|---|
| ProTrendLines | 13.897 | 13.962 | 14.001 | 14.027 | 14.042 | 14.069 | 14.100 |
| Change (%) | -0.93% | -0.46% | -0.19% | - | +0.11% | +0.30% | +0.52% |
| Change | -0.130 | -0.065 | -0.026 | - | +0.015 | +0.042 | +0.073 |
| Level | Minor | Intermediate | Intermediate | - | Major | Minor | Intermediate |
Attention could also be paid to pivot points to set price objectives:
| Pivot points | S3 | S2 | S1 | PP | R1 | R2 | R3 |
|---|---|---|---|---|---|---|---|
| Standard | 13.888 | 13.925 | 13.976 | 14.013 | 14.064 | 14.101 | 14.152 |
| Camarilla | 14.004 | 14.012 | 14.020 | 14.028 | 14.036 | 14.044 | 14.052 |
| Woodie | 13.896 | 13.929 | 13.984 | 14.017 | 14.072 | 14.105 | 14.160 |
| Fibonacci | 13.925 | 13.958 | 13.979 | 14.013 | 14.046 | 14.067 | 14.101 |
| Pivot points | S3 | S2 | S1 | PP | R1 | R2 | R3 |
|---|---|---|---|---|---|---|---|
| Standard | 13.727 | 13.845 | 13.962 | 14.080 | 14.197 | 14.315 | 14.432 |
| Camarilla | 14.015 | 14.037 | 14.059 | 14.080 | 14.102 | 14.123 | 14.145 |
| Woodie | 13.728 | 13.845 | 13.963 | 14.080 | 14.198 | 14.315 | 14.433 |
| Fibonacci | 13.845 | 13.934 | 13.990 | 14.080 | 14.169 | 14.225 | 14.315 |
| Pivot points | S3 | S2 | S1 | PP | R1 | R2 | R3 |
|---|---|---|---|---|---|---|---|
| Standard | 13.364 | 13.539 | 13.846 | 14.021 | 14.328 | 14.503 | 14.810 |
| Camarilla | 14.022 | 14.066 | 14.110 | 14.154 | 14.198 | 14.242 | 14.287 |
| Woodie | 13.431 | 13.572 | 13.913 | 14.054 | 14.395 | 14.536 | 14.877 |
| Fibonacci | 13.539 | 13.723 | 13.837 | 14.021 | 14.205 | 14.319 | 14.503 |
Numerical data
The following are the details of the technical indicators and moving averages that were collected to generate this technical analysis:
| RSI (14): | 50.55 | |
| MACD (12,26,9): | 0.0080 | |
| Directional Movement: | 1.838 | |
| AROON (14): | 85.714 | |
| DEMA (21): | 14.042 | |
| Parabolic SAR (0,02-0,02-0,2): | 14.019 | |
| Elder Ray (13): | 0.002 | |
| Super Trend (3,10): | 13.988 | |
| Zig ZAG (10): | 14.028 | |
| VORTEX (21): | 1.0190 | |
| Stochastique (14,3,5): | 60.13 | |
| TEMA (21): | 14.044 | |
| Williams %R (14): | -82.50 | |
| Chande Momentum Oscillator (20): | -0.007 | |
| Repulse (5,40,3): | -0.1250 | |
| ROCnROLL: | -1 | |
| TRIX (15,9): | 0.0100 | |
| Courbe Coppock: | 0.19 |
| MA7: | 14.055 | |
| MA20: | 14.025 | |
| MA50: | 13.792 | |
| MA100: | 13.679 | |
| MAexp7: | 14.037 | |
| MAexp20: | 14.031 | |
| MAexp50: | 14.023 | |
| MAexp100: | 14.032 | |
| Price / MA7: | -0.20% | |
| Price / MA20: | +0.01% | |
| Price / MA50: | +1.70% | |
| Price / MA100: | +2.54% | |
| Price / MAexp7: | -0.07% | |
| Price / MAexp20: | -0.03% | |
| Price / MAexp50: | +0.03% | |
| Price / MAexp100: | -0.04% |
About author
Online


Add a comment
Comments
0 comments on the analysis NZD/CZK - 1H