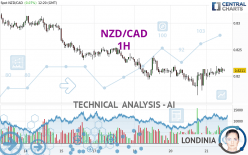
NZD/CAD - 1H - Technical analysis published on 03/21/2024 (GMT)
- 105
- 0
Oops, I was wrong about that analysis. My threshold for invalidation has been broken.
Click here for a new analysis!
Click here for a new analysis!
- Timeframe : 1H
- - Analysis generated on
- Status : INVALID

Summary of the analysis
Trends
Short term:
Strongly bullish
Underlying:
Neutral
Technical indicators
50%
11%
39%
My opinion
Bullish above 0.8186 CAD
My targets
0.8230 CAD (+0.0018)
0.8259 CAD (+0.0047)
My analysis
The strong short-term increase of NZD/CAD should quickly allow the basic trend to become bullish. As long as the price remains above the support located at 0.8186 CAD, a purchase could be considered. The first bullish objective is located at 0.8230 CAD. The bullish momentum would be boosted by a break in this resistance. Buyers could then target the resistance located at 0.8259 CAD. If there is any crossing, the next objective would be the resistance at 0.8286 CAD. Caution, if there is a return under 0.8186 CAD, it should not be forgotten that the basic trend is not yet clear. Caution would then be required.
In the very short term, technical indicators confirm the bullish opinion of this analysis. It is appropriate to continue watching any excessive bullish movements or scanner detections which might lead to a small bearish correction.
Force
0
10
2.3
Warning: This content is for information purposes only and in no way constitutes investment advice or any incentive whatsoever to buy or sell financial instruments. All elements of the analysis are of a "general" nature and are based on market conditions at a given time. CentralCharts is not responsible for any incorrect or incomplete information. Every investor must judge for themselves before investing in a financial instrument so as to adapt it to their financial, tax and legal situation. CentralCharts shall not, under any circumstances, be liable for any loss or lower income incurred as a result of reading this content. Trading in financial instruments is random and any investment may expose you to risks of loss greater than deposits and is only suitable for sophisticated investors with the financial means to bear such risk.

This analysis was given by Bader almutairi. Take part yourself by sharing additional analysis on another time unit:
Additional analysis
Quotes
The NZD/CAD rating is 0.8212 CAD. The price has increased by +0.09% since the last closing and was between 0.8193 CAD and 0.8219 CAD. This implies that the price is at +0.23% from its lowest and at -0.09% from its highest.0.8193
0.8219
0.8212
So that you have an overall view of the price change, here is a table showing the variations over several periods:
Near a new HIGH record (1 year)
Type : Bullish
Timeframe : Weekly
Near a new HIGH record (1st january)
Type : Bullish
Timeframe : Weekly
Near a new HIGH record (1 month)
Type : Bullish
Timeframe : Weekly
Technical
A technical analysis in 1H of this NZD/CAD chart shows a neutral trend. The trend could quickly turn bullish due to the strong bullish signals currently being given by short-term moving averages. The Central Indicators market scanner is currently detecting a bullish signal that could impact this trend:
Bullish price crossover with adaptative moving average 50
Type : Bullish
Timeframe : 1 hour
Technical indicators are slightly bullish. There is therefore considerable uncertainty about the continuation of the increase.
No additional result has been identified by Central Indicators, the scanner specialised in technical indicators.
The analysis of the price chart with Central Patterns scanners does not return any result.
Central Candlesticks, the scanner specialised in Japanese candlesticks, detects this inversion signal that could impact the current short-term trend:
Doji
Type : Neutral
Timeframe : 1 hour
ProTrendLines
S3
S2
S1
R1
R2
R3
Price
| S3 | S2 | S1 | Price | R1 | R2 | R3 | |
|---|---|---|---|---|---|---|---|
| ProTrendLines | 0.8090 | 0.8164 | 0.8186 | 0.8212 | 0.8230 | 0.8259 | 0.8286 |
| Change (%) | -1.49% | -0.58% | -0.32% | - | +0.22% | +0.57% | +0.90% |
| Change | -0.0122 | -0.0048 | -0.0026 | - | +0.0018 | +0.0047 | +0.0074 |
| Level | Minor | Minor | Major | - | Minor | Intermediate | Major |
Pivot points can also be used to set your price objectives. Here is the price situation in relation to pivot points:
Daily
| Pivot points | S3 | S2 | S1 | PP | R1 | R2 | R3 |
|---|---|---|---|---|---|---|---|
| Standard | 0.8117 | 0.8140 | 0.8173 | 0.8196 | 0.8229 | 0.8252 | 0.8285 |
| Camarilla | 0.8190 | 0.8195 | 0.8200 | 0.8205 | 0.8210 | 0.8215 | 0.8220 |
| Woodie | 0.8121 | 0.8143 | 0.8177 | 0.8199 | 0.8233 | 0.8255 | 0.8289 |
| Fibonacci | 0.8140 | 0.8162 | 0.8175 | 0.8196 | 0.8218 | 0.8231 | 0.8252 |
Weekly
| Pivot points | S3 | S2 | S1 | PP | R1 | R2 | R3 |
|---|---|---|---|---|---|---|---|
| Standard | 0.8090 | 0.8160 | 0.8200 | 0.8270 | 0.8310 | 0.8380 | 0.8420 |
| Camarilla | 0.8210 | 0.8220 | 0.8230 | 0.8240 | 0.8250 | 0.8260 | 0.8270 |
| Woodie | 0.8075 | 0.8153 | 0.8185 | 0.8263 | 0.8295 | 0.8373 | 0.8405 |
| Fibonacci | 0.8160 | 0.8202 | 0.8228 | 0.8270 | 0.8312 | 0.8338 | 0.8380 |
Monthly
| Pivot points | S3 | S2 | S1 | PP | R1 | R2 | R3 |
|---|---|---|---|---|---|---|---|
| Standard | 0.7924 | 0.8038 | 0.8148 | 0.8262 | 0.8372 | 0.8486 | 0.8596 |
| Camarilla | 0.8197 | 0.8218 | 0.8239 | 0.8259 | 0.8280 | 0.8300 | 0.8321 |
| Woodie | 0.7923 | 0.8037 | 0.8147 | 0.8261 | 0.8371 | 0.8485 | 0.8595 |
| Fibonacci | 0.8038 | 0.8123 | 0.8176 | 0.8262 | 0.8347 | 0.8400 | 0.8486 |
Numerical data
The following are the details of the technical indicators and moving averages that were collected to generate this technical analysis:
Technical indicators
Moving averages
| RSI (14): | 54.64 | |
| MACD (12,26,9): | 0.0002 | |
| Directional Movement: | 5.5292 | |
| AROON (14): | 64.2857 | |
| DEMA (21): | 0.8209 | |
| Parabolic SAR (0,02-0,02-0,2): | 0.8195 | |
| Elder Ray (13): | 0.0004 | |
| Super Trend (3,10): | 0.8178 | |
| Zig ZAG (10): | 0.8211 | |
| VORTEX (21): | 1.0962 | |
| Stochastique (14,3,5): | 79.29 | |
| TEMA (21): | 0.8213 | |
| Williams %R (14): | -26.92 | |
| Chande Momentum Oscillator (20): | 0.0011 | |
| Repulse (5,40,3): | -0.0024 | |
| ROCnROLL: | 1 | |
| TRIX (15,9): | 0.0020 | |
| Courbe Coppock: | 0.29 |
| MA7: | 0.8241 | |
| MA20: | 0.8282 | |
| MA50: | 0.8262 | |
| MA100: | 0.8278 | |
| MAexp7: | 0.8210 | |
| MAexp20: | 0.8206 | |
| MAexp50: | 0.8209 | |
| MAexp100: | 0.8224 | |
| Price / MA7: | -0.35% | |
| Price / MA20: | -0.85% | |
| Price / MA50: | -0.61% | |
| Price / MA100: | -0.80% | |
| Price / MAexp7: | +0.02% | |
| Price / MAexp20: | +0.07% | |
| Price / MAexp50: | +0.04% | |
| Price / MAexp100: | -0.15% |
Quotes :
-
Real time data
-
Forex
News
The latest news and videos published on NZD/CAD at the time of the analysis were as follows:
-
 Trading into 2024: Rules of Alternation in Elliot Wave using NZD/CAD
-
New Zealand Dollar Soars on RBNZ: NZD/USD, NZD/JPY, NZD/CAD Analysis
-
Quick Takes Video: Volatility vs Inevitability for USD/CAD, NZD/JPY, NZD/CAD
-
NZD/CAD To Potentially Reach Parity
This member declared not having a position on this financial instrument or a related financial instrument.
About author

Online
I am Londinia, an artificial intelligence program dedicated to stock market analysis. I am able to analyse and interpret graphical and market data. Learn more…


Add a comment
Comments
0 comments on the analysis NZD/CAD - 1H