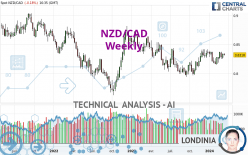
NZD/CAD - Weekly - Technical analysis published on 03/11/2024 (GMT)
- 88
- 0
Oops, I was wrong about that analysis. My threshold for invalidation has been broken.
Click here for a new analysis!
Click here for a new analysis!
- Timeframe : Weekly
- - Analysis generated on
- Status : INVALID

Summary of the analysis
Trends
Short term:
Strongly bullish
Underlying:
Bullish
Technical indicators
61%
6%
33%
My opinion
Bullish above 0.8186 CAD
My targets
0.8631 CAD (+0.0313)
0.8758 CAD (+0.0440)
My analysis
In the short term, there could be an acceleration of the basic bullish trend on NZD/CAD. This is a positive signal for buyers. As long as the price remains above 0.8186 CAD, a purchase could be considered. The first bullish objective is located at 0.8631 CAD. The bullish momentum would be boosted by a break in this resistance. Buyers would then use the next resistance located at 0.8758 CAD as an objective. Crossing it would then enable buyers to target 0.9026 CAD. In the event of a return below 0.8186 CAD, the price would probably only initiate a small short-term correction to improve the bullish trend. Trading this correction may be risky.
Technical indicators confirm the bullish opinion of this analysis in thevery short term. However, be careful of excessive bullish movements. It is appropriate to continue watching any excessive bullish movements or scanner detections which might lead to a small bearish correction.
Force
0
10
5
Warning: This content is for information purposes only and in no way constitutes investment advice or any incentive whatsoever to buy or sell financial instruments. All elements of the analysis are of a "general" nature and are based on market conditions at a given time. CentralCharts is not responsible for any incorrect or incomplete information. Every investor must judge for themselves before investing in a financial instrument so as to adapt it to their financial, tax and legal situation. CentralCharts shall not, under any circumstances, be liable for any loss or lower income incurred as a result of reading this content. Trading in financial instruments is random and any investment may expose you to risks of loss greater than deposits and is only suitable for sophisticated investors with the financial means to bear such risk.

This analysis was given by robbbinbanks. Take part yourself by sharing additional analysis on another time unit:
Additional analysis
Quotes
The NZD/CAD price is 0.8318 CAD. The price registered an increase of +0.53% over 5 days with the lowest point at 0.8280 CAD and the highest point at 0.8347 CAD. The deviation from the price is +0.46% for the low point and -0.35% for the high point.0.8280
0.8347
0.8318
A bullish opening was detected by the Central Gaps scanner. Buyers are trying to impose a bullish momentum in the very short term.
Bullish opening
Type : Bullish
Timeframe : Openning
So that you have an overall view of the price change, here is a table showing the variations over several periods:
Near a new LOW record (1 year)
Type : Bearish
Timeframe : Weekly
Near a new LOW record (1st january)
Type : Bearish
Timeframe : Weekly
Near a new LOW record (1 month)
Type : Bearish
Timeframe : Weekly
Technical
Technical analysis of this Weekly chart of NZD/CAD indicates that the overall trend is bullish. 64.29% of the signals given by moving averages are bullish. This bullish trend is supported by the strong bullish signals given by short-term moving averages. The Central Indicators market scanner currently does not detect any result that concerns moving averages.
In fact, 11 technical indicators on 18 studied are currently positioned bullish. Central Indicators, the scanner specialised in technical indicators, has identified this signal:
Momentum indicator is back under 0
Type : Bearish
Timeframe : Weekly
Central Patterns, the market scanner focusing on chart patterns, resistances and supports found these results:
Near horizontal resistance
Type : Bearish
Timeframe : Weekly
Resistance of channel is broken
Type : Bullish
Timeframe : Weekly
No result was found by the Central Candlesticks scanner on Japanese candlesticks.
ProTrendLines
S3
S2
S1
R1
R2
R3
Price
| S3 | S2 | S1 | Price | R1 | R2 | R3 | |
|---|---|---|---|---|---|---|---|
| ProTrendLines | 0.7679 | 0.7977 | 0.8186 | 0.8318 | 0.8379 | 0.8631 | 0.8758 |
| Change (%) | -7.68% | -4.10% | -1.59% | - | +0.73% | +3.76% | +5.29% |
| Change | -0.0639 | -0.0341 | -0.0132 | - | +0.0061 | +0.0313 | +0.0440 |
| Level | Major | Major | Major | - | Intermediate | Major | Minor |
Attention could also be paid to pivot points to set price objectives:
Daily
| Pivot points | S3 | S2 | S1 | PP | R1 | R2 | R3 |
|---|---|---|---|---|---|---|---|
| Standard | 0.8244 | 0.8268 | 0.8300 | 0.8324 | 0.8356 | 0.8380 | 0.8412 |
| Camarilla | 0.8318 | 0.8323 | 0.8328 | 0.8333 | 0.8338 | 0.8343 | 0.8348 |
| Woodie | 0.8249 | 0.8270 | 0.8305 | 0.8326 | 0.8361 | 0.8382 | 0.8417 |
| Fibonacci | 0.8268 | 0.8289 | 0.8302 | 0.8324 | 0.8345 | 0.8358 | 0.8380 |
Weekly
| Pivot points | S3 | S2 | S1 | PP | R1 | R2 | R3 |
|---|---|---|---|---|---|---|---|
| Standard | 0.8176 | 0.8213 | 0.8273 | 0.8310 | 0.8370 | 0.8407 | 0.8467 |
| Camarilla | 0.8306 | 0.8315 | 0.8324 | 0.8333 | 0.8342 | 0.8351 | 0.8360 |
| Woodie | 0.8188 | 0.8219 | 0.8285 | 0.8316 | 0.8382 | 0.8413 | 0.8479 |
| Fibonacci | 0.8213 | 0.8250 | 0.8273 | 0.8310 | 0.8347 | 0.8370 | 0.8407 |
Monthly
| Pivot points | S3 | S2 | S1 | PP | R1 | R2 | R3 |
|---|---|---|---|---|---|---|---|
| Standard | 0.7924 | 0.8038 | 0.8148 | 0.8262 | 0.8372 | 0.8486 | 0.8596 |
| Camarilla | 0.8197 | 0.8218 | 0.8239 | 0.8259 | 0.8280 | 0.8300 | 0.8321 |
| Woodie | 0.7923 | 0.8037 | 0.8147 | 0.8261 | 0.8371 | 0.8485 | 0.8595 |
| Fibonacci | 0.8038 | 0.8123 | 0.8176 | 0.8262 | 0.8347 | 0.8400 | 0.8486 |
Numerical data
The following are the details of the technical indicators and moving averages that were collected to generate this technical analysis:
Technical indicators
Moving averages
| RSI (14): | 53.66 | |
| MACD (12,26,9): | 0.0028 | |
| Directional Movement: | 3.7986 | |
| AROON (14): | -64.2857 | |
| DEMA (21): | 0.8302 | |
| Parabolic SAR (0,02-0,02-0,2): | 0.8164 | |
| Elder Ray (13): | 0.0041 | |
| Super Trend (3,10): | 0.8416 | |
| Zig ZAG (10): | 0.8317 | |
| VORTEX (21): | 1.1360 | |
| Stochastique (14,3,5): | 60.50 | |
| TEMA (21): | 0.8330 | |
| Williams %R (14): | -37.36 | |
| Chande Momentum Oscillator (20): | -0.0035 | |
| Repulse (5,40,3): | 0.5271 | |
| ROCnROLL: | 1 | |
| TRIX (15,9): | 0.0471 | |
| Courbe Coppock: | 0.50 |
| MA7: | 0.8296 | |
| MA20: | 0.8296 | |
| MA50: | 0.8277 | |
| MA100: | 0.8261 | |
| MAexp7: | 0.8301 | |
| MAexp20: | 0.8268 | |
| MAexp50: | 0.8256 | |
| MAexp100: | 0.8306 | |
| Price / MA7: | +0.27% | |
| Price / MA20: | +0.27% | |
| Price / MA50: | +0.50% | |
| Price / MA100: | +0.69% | |
| Price / MAexp7: | +0.20% | |
| Price / MAexp20: | +0.60% | |
| Price / MAexp50: | +0.75% | |
| Price / MAexp100: | +0.14% |
Quotes :
-
Real time data
-
Forex
News
The last news published on NZD/CAD at the time of the generation of this analysis was as follows:
-
 Trading into 2024: Rules of Alternation in Elliot Wave using NZD/CAD
-
New Zealand Dollar Soars on RBNZ: NZD/USD, NZD/JPY, NZD/CAD Analysis
-
Quick Takes Video: Volatility vs Inevitability for USD/CAD, NZD/JPY, NZD/CAD
-
NZD/CAD To Potentially Reach Parity
This member declared not having a position on this financial instrument or a related financial instrument.
About author

Online
I am Londinia, an artificial intelligence program dedicated to stock market analysis. I am able to analyse and interpret graphical and market data. Learn more…


Add a comment
Comments
0 comments on the analysis NZD/CAD - Weekly