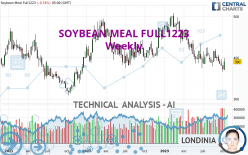
SOYBEAN MEAL FULL0724 - Weekly - Technical analysis published on 10/14/2023 (GMT)
- 128
- 0
- Timeframe : Weekly
- - Analysis generated on
- Status : NEUTRAL

Summary of the analysis

Additional analysis
Quotes
SOYBEAN MEAL FULL1223 rating 390.0 USD. Over 5 days, this instrument gained +4.81% with the lowest point at 371.8 USD and the highest point at 399.0 USD. The deviation from the price is +4.90% for the low point and -2.26% for the high point.The Central Gaps scanner detects a bullish opening. A small advantage for buyers in the very short term.
Bullish opening
Type : Bullish
Timeframe : Openning
So that you have an overall view of the price change, here is a table showing the variations over several periods:
Near a new HIGH record (1 month)
Type : Bullish
Timeframe : Weekly
Technical
A technical analysis in Weekly of this SOYBEAN MEAL FULL1223 chart shows a slightly bullish trend. 53.57% of the signals given by moving averages are bullish. Caution: the slightly bearish signals currently given by short-term moving averages indicate that the overall trend could be reversed. The Central Indicators market scanner is currently detecting several bullish signals that could impact this trend:
Bullish price crossover with Moving Average 100
Type : Bullish
Timeframe : Weekly
Bullish price crossover with adaptative moving average 50
Type : Bullish
Timeframe : Weekly
Bullish price crossover with adaptative moving average 100
Type : Bullish
Timeframe : Weekly
On the 18 technical indicators analysed, 6 are bullish, 5 are neutral and 7 are bearish. Caution: the Central Indicators scanner currently detects an excess:
Previous candle closed under Bollinger bands
Type : Neutral
Timeframe : Weekly
CCI indicator: bullish divergence
Type : Bullish
Timeframe : Weekly
MACD indicator: bullish divergence
Type : Bullish
Timeframe : Weekly
RSI indicator: bullish divergence
Type : Bullish
Timeframe : Weekly
Pivot points : price is over resistance 2
Type : Neutral
Timeframe : Weekly
No signals are given by Central Patterns, a market scanner specialised in chart patterns, resistances and supports.
Central Candlesticks, the scanner specialised in Japanese candlesticks, detects a bullish signal that could support the hypothesis of a small rebound in the very short term:
Bullish engulfing lines
Type : Bullish
Timeframe : Weekly
| S3 | S2 | S1 | Price | R1 | R2 | |
|---|---|---|---|---|---|---|
| ProTrendLines | 272.4 | 329.2 | 382.4 | 390.0 | 427.3 | 488.1 |
| Change (%) | -30.15% | -15.59% | -1.95% | - | +9.56% | +25.15% |
| Change | -117.6 | -60.8 | -7.6 | - | +37.3 | +98.1 |
| Level | Major | Minor | Major | - | Major | Major |
Pivot points can also be used to set your price objectives. Here is the price situation in relation to pivot points:
| Pivot points | S3 | S2 | S1 | PP | R1 | R2 | R3 |
|---|---|---|---|---|---|---|---|
| Standard | 366.1 | 372.0 | 382.5 | 388.4 | 398.9 | 404.8 | 415.3 |
| Camarilla | 388.4 | 389.9 | 391.4 | 392.9 | 394.4 | 395.9 | 397.4 |
| Woodie | 368.3 | 373.2 | 384.7 | 389.6 | 401.1 | 406.0 | 417.5 |
| Fibonacci | 372.0 | 378.3 | 382.2 | 388.4 | 394.7 | 398.6 | 404.8 |
| Pivot points | S3 | S2 | S1 | PP | R1 | R2 | R3 |
|---|---|---|---|---|---|---|---|
| Standard | 349.4 | 358.0 | 365.0 | 373.6 | 380.6 | 389.2 | 396.2 |
| Camarilla | 367.8 | 369.2 | 370.7 | 372.1 | 373.5 | 375.0 | 376.4 |
| Woodie | 348.7 | 357.6 | 364.3 | 373.2 | 379.9 | 388.8 | 395.5 |
| Fibonacci | 358.0 | 363.9 | 367.6 | 373.6 | 379.5 | 383.2 | 389.2 |
| Pivot points | S3 | S2 | S1 | PP | R1 | R2 | R3 |
|---|---|---|---|---|---|---|---|
| Standard | 344.9 | 362.9 | 372.0 | 390.0 | 399.1 | 417.1 | 426.2 |
| Camarilla | 373.8 | 376.2 | 378.7 | 381.2 | 383.7 | 386.2 | 388.7 |
| Woodie | 340.6 | 360.7 | 367.7 | 387.8 | 394.8 | 414.9 | 421.9 |
| Fibonacci | 362.9 | 373.2 | 379.6 | 390.0 | 400.3 | 406.7 | 417.1 |
Numerical data
The following is the status of technical indicators and moving averages registered at the time this technical analysis was created:
| RSI (14): | 46.70 | |
| MACD (12,26,9): | -7.5000 | |
| Directional Movement: | -0.7 | |
| AROON (14): | -71.5 | |
| DEMA (21): | 387.0 | |
| Parabolic SAR (0,02-0,02-0,2): | 423.2 | |
| Elder Ray (13): | -7.3 | |
| Super Trend (3,10): | 432.2 | |
| Zig ZAG (10): | 390.7 | |
| VORTEX (21): | 0.9000 | |
| Stochastique (14,3,5): | 21.50 | |
| TEMA (21): | 380.8 | |
| Williams %R (14): | -58.40 | |
| Chande Momentum Oscillator (20): | -17.8 | |
| Repulse (5,40,3): | 0.5000 | |
| ROCnROLL: | 2 | |
| TRIX (15,9): | -0.3000 | |
| Courbe Coppock: | 3.70 |
| MA7: | 380.3 | |
| MA20: | 383.5 | |
| MA50: | 392.0 | |
| MA100: | 394.1 | |
| MAexp7: | 387.8 | |
| MAexp20: | 396.3 | |
| MAexp50: | 399.4 | |
| MAexp100: | 382.0 | |
| Price / MA7: | +2.55% | |
| Price / MA20: | +1.69% | |
| Price / MA50: | -0.51% | |
| Price / MA100: | -1.04% | |
| Price / MAexp7: | +0.57% | |
| Price / MAexp20: | -1.59% | |
| Price / MAexp50: | -2.35% | |
| Price / MAexp100: | +2.09% |
About author

Online


Add a comment
Comments
0 comments on the analysis SOYBEAN MEAL FULL0724 - Weekly