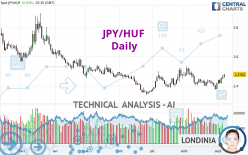
JPY/HUF - Daily - Technical analysis published on 09/07/2023 (GMT)
- 105
- 0
Click here for a new analysis!
- Timeframe : Daily
- - Analysis generated on
- Status : INVALID

Summary of the analysis

Additional analysis
Quotes
The JPY/HUF price is 2.4784 HUF. The price has increased by +0.83% since the last closing and was traded between 2.4565 HUF and 2.4792 HUF over the period. The price is currently at +0.89% from its lowest and -0.03% from its highest.A bearish opening was detected by the Central Gaps scanner. Sellers are trying to impose a bearish trend in the very short term.
Bearish opening
Type : Bearish
Timeframe : Openning
A study of price movements over other periods shows the following variations:
Near a new LOW record (5 years)
Type : Bearish
Timeframe : Weekly
Near a new LOW record (1 year)
Type : Bearish
Timeframe : Weekly
Near a new LOW record (1st january)
Type : Bearish
Timeframe : Weekly
Near a new LOW record (1 month)
Type : Bearish
Timeframe : Weekly
Technical
A technical analysis in Daily of this JPY/HUF chart shows a neutral trend. This indecision could turn into a bullish trend due to the strong bullish signals currently being given by short-term moving averages. The Central Indicators scanner detects a bullish signal on moving averages that could impact this trend:
Bullish price crossover with adaptative moving average 100
Type : Bullish
Timeframe : Daily
The probability of a further increase is high given the direction of the technical indicators.
Caution: the Central Indicators scanner currently detects an excess:
CCI indicator is overbought : over 100
Type : Neutral
Timeframe : Daily
Williams %R indicator is overbought : over -20
Type : Neutral
Timeframe : Daily
Pivot points : price is over resistance 1
Type : Neutral
Timeframe : Daily
Pivot points : price is over resistance 1
Type : Neutral
Timeframe : Weekly
MACD indicator is back over 0
Type : Bullish
Timeframe : Daily
The Central Patterns scanner, which studies chart patterns, resistances and supports, has identified this signal:
Near resistance of channel
Type : Bearish
Timeframe : Daily
Central Candlesticks, the scanner specialised in Japanese candlesticks, detects a bullish signal that could support the hypothesis of a small rebound in the very short term:
Three white soldiers
Type : Bullish
Timeframe : Daily
| S3 | S2 | S1 | Price | R1 | R2 | R3 | |
|---|---|---|---|---|---|---|---|
| ProTrendLines | 2.3491 | 2.3939 | 2.4473 | 2.4784 | 2.4985 | 2.5711 | 2.6604 |
| Change (%) | -5.22% | -3.41% | -1.25% | - | +0.81% | +3.74% | +7.34% |
| Change | -0.1293 | -0.0845 | -0.0311 | - | +0.0201 | +0.0927 | +0.1820 |
| Level | Major | Major | Intermediate | - | Minor | Major | Major |
Attention could also be paid to pivot points to set price objectives:
| Pivot points | S3 | S2 | S1 | PP | R1 | R2 | R3 |
|---|---|---|---|---|---|---|---|
| Standard | 2.4142 | 2.4293 | 2.4437 | 2.4588 | 2.4732 | 2.4883 | 2.5027 |
| Camarilla | 2.4500 | 2.4527 | 2.4554 | 2.4581 | 2.4608 | 2.4635 | 2.4662 |
| Woodie | 2.4139 | 2.4291 | 2.4434 | 2.4586 | 2.4729 | 2.4881 | 2.5024 |
| Fibonacci | 2.4293 | 2.4406 | 2.4475 | 2.4588 | 2.4701 | 2.4770 | 2.4883 |
| Pivot points | S3 | S2 | S1 | PP | R1 | R2 | R3 |
|---|---|---|---|---|---|---|---|
| Standard | 2.3244 | 2.3483 | 2.3930 | 2.4169 | 2.4616 | 2.4855 | 2.5302 |
| Camarilla | 2.4187 | 2.4250 | 2.4313 | 2.4376 | 2.4439 | 2.4502 | 2.4565 |
| Woodie | 2.3347 | 2.3535 | 2.4033 | 2.4221 | 2.4719 | 2.4907 | 2.5405 |
| Fibonacci | 2.3483 | 2.3745 | 2.3907 | 2.4169 | 2.4431 | 2.4593 | 2.4855 |
| Pivot points | S3 | S2 | S1 | PP | R1 | R2 | R3 |
|---|---|---|---|---|---|---|---|
| Standard | 2.1866 | 2.2794 | 2.3480 | 2.4408 | 2.5094 | 2.6022 | 2.6708 |
| Camarilla | 2.3721 | 2.3869 | 2.4017 | 2.4165 | 2.4313 | 2.4461 | 2.4609 |
| Woodie | 2.1744 | 2.2734 | 2.3358 | 2.4348 | 2.4972 | 2.5962 | 2.6586 |
| Fibonacci | 2.2794 | 2.3411 | 2.3792 | 2.4408 | 2.5025 | 2.5406 | 2.6022 |
Numerical data
The following are the details of the technical indicators and moving averages that were collected to generate this technical analysis:
| RSI (14): | 59.00 | |
| MACD (12,26,9): | 0.0021 | |
| Directional Movement: | 8.1886 | |
| AROON (14): | 42.8571 | |
| DEMA (21): | 2.4354 | |
| Parabolic SAR (0,02-0,02-0,2): | 2.3887 | |
| Elder Ray (13): | 0.0314 | |
| Super Trend (3,10): | 2.4792 | |
| Zig ZAG (10): | 2.4768 | |
| VORTEX (21): | 1.0019 | |
| Stochastique (14,3,5): | 92.46 | |
| TEMA (21): | 2.4396 | |
| Williams %R (14): | -1.12 | |
| Chande Momentum Oscillator (20): | 0.0558 | |
| Repulse (5,40,3): | 1.9651 | |
| ROCnROLL: | 1 | |
| TRIX (15,9): | -0.0283 | |
| Courbe Coppock: | 0.89 |
| MA7: | 2.4338 | |
| MA20: | 2.4263 | |
| MA50: | 2.4362 | |
| MA100: | 2.4529 | |
| MAexp7: | 2.4449 | |
| MAexp20: | 2.4351 | |
| MAexp50: | 2.4408 | |
| MAexp100: | 2.4781 | |
| Price / MA7: | +1.83% | |
| Price / MA20: | +2.15% | |
| Price / MA50: | +1.73% | |
| Price / MA100: | +1.04% | |
| Price / MAexp7: | +1.37% | |
| Price / MAexp20: | +1.78% | |
| Price / MAexp50: | +1.54% | |
| Price / MAexp100: | +0.01% |
About author
Online


Add a comment
Comments
0 comments on the analysis JPY/HUF - Daily