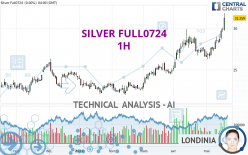
SILVER FULL0724 - 1H - Technical analysis published on 05/20/2024 (GMT)
- 51
- 0
Oops, I was wrong about that analysis. My threshold for invalidation has been broken.
Click here for a new analysis!
Click here for a new analysis!
- Timeframe : 1H
- - Analysis generated on
- Status : INVALID

Summary of the analysis
Trends
Short term:
Strongly bullish
Underlying:
Strongly bullish
Technical indicators
78%
0%
22%
My opinion
Bullish above 31.818 USD
My targets
34.096 USD (+4.59%)
36.343 USD (+11.48%)
My analysis
All elements being clearly bullish, it would be possible for traders to trade only long positions (at the time of purchase) on SILVER FULL0724 as long as the price remains well above 31.818 USD. The buyers' bullish objective is set at 34.096 USD. A bullish break in this resistance would boost the bullish momentum. The buyers could then target the resistance located at 36.343 USD. If there is any crossing, the next objective would be the resistance located at 40.502 USD. However, beware of bullish excesses that could lead to a possible short-term correction; but this possible correction would not be tradeable.
In the very short term, the general bullish sentiment is confirmed by technical indicators. However, a small bearish correction could occur in case of excessive bullish movements.
Force
0
10
8.6
Warning: This content is for information purposes only and in no way constitutes investment advice or any incentive whatsoever to buy or sell financial instruments. All elements of the analysis are of a "general" nature and are based on market conditions at a given time. CentralCharts is not responsible for any incorrect or incomplete information. Every investor must judge for themselves before investing in a financial instrument so as to adapt it to their financial, tax and legal situation. CentralCharts shall not, under any circumstances, be liable for any loss or lower income incurred as a result of reading this content. Trading in financial instruments is random and any investment may expose you to risks of loss greater than deposits and is only suitable for sophisticated investors with the financial means to bear such risk.

This analysis was given by Barts_XV. Take part yourself by sharing additional analysis on another time unit:
Additional analysis
Quotes
The SILVER FULL0724 price is 32.600 USD. The price has increased by +4.29% since the last closing and was between 31.535 USD and 32.750 USD. This implies that the price is at +3.38% from its lowest and at -0.46% from its highest.31.535
32.750
32.600
So that you have an overall view of the price change, here is a table showing the variations over several periods:
Near a new HIGH record (1 year)
Type : Bullish
Timeframe : Weekly
Near a new HIGH record (1st january)
Type : Bullish
Timeframe : Weekly
Near a new HIGH record (1 month)
Type : Bullish
Timeframe : Weekly
Technical
Technical analysis of SILVER FULL0724 in 1H shows a strongly overall bullish trend. 92.86% of the signals given by moving averages are bullish. This strongly bullish trend is supported by the strong bullish signals given by short-term moving averages. The Central Indicators market scanner currently does not detect any result that concerns moving averages.
In fact, according to the parameters integrated into the Central Analyzer system, 14 technical indicators out of 18 analysed are currently bullish. But beware of excesses. The Central Indicators scanner currently detects this:
RSI indicator is overbought : over 80
Type : Neutral
Timeframe : 1 hour
RSI indicator: bearish divergence
Type : Bearish
Timeframe : 1 hour
Williams %R indicator is overbought : over -20
Type : Neutral
Timeframe : 1 hour
No signals are given by Central Patterns, a market scanner specialised in chart patterns, resistances and supports.
The Central Candlesticks scanner, specialised in Japanese candlesticks, did not identify any signals.
ProTrendLines
S3
S2
S1
R1
R2
Price
| S3 | S2 | S1 | Price | R1 | R2 | |
|---|---|---|---|---|---|---|
| ProTrendLines | 29.703 | 30.603 | 31.818 | 32.600 | 40.502 | 54.444 |
| Change (%) | -8.89% | -6.13% | -2.40% | - | +24.24% | +67.01% |
| Change | -2.897 | -1.997 | -0.782 | - | +7.902 | +21.844 |
| Level | Minor | Minor | Major | - | Minor | Major |
Pivot points can also be used to set your price objectives. Here is the price situation in relation to pivot points:
Daily
| Pivot points | S3 | S2 | S1 | PP | R1 | R2 | R3 |
|---|---|---|---|---|---|---|---|
| Standard | 27.873 | 28.786 | 30.023 | 30.936 | 32.173 | 33.086 | 34.323 |
| Camarilla | 30.668 | 30.865 | 31.062 | 31.259 | 31.456 | 31.653 | 31.850 |
| Woodie | 28.034 | 28.867 | 30.184 | 31.017 | 32.334 | 33.167 | 34.484 |
| Fibonacci | 28.786 | 29.608 | 30.115 | 30.936 | 31.758 | 32.265 | 33.086 |
Weekly
| Pivot points | S3 | S2 | S1 | PP | R1 | R2 | R3 |
|---|---|---|---|---|---|---|---|
| Standard | 25.348 | 26.766 | 29.013 | 30.431 | 32.678 | 34.096 | 36.343 |
| Camarilla | 30.251 | 30.587 | 30.923 | 31.259 | 31.595 | 31.931 | 32.267 |
| Woodie | 25.762 | 26.973 | 29.427 | 30.638 | 33.092 | 34.303 | 36.757 |
| Fibonacci | 26.766 | 28.166 | 29.031 | 30.431 | 31.831 | 32.696 | 34.096 |
Monthly
| Pivot points | S3 | S2 | S1 | PP | R1 | R2 | R3 |
|---|---|---|---|---|---|---|---|
| Standard | 20.042 | 22.756 | 24.752 | 27.466 | 29.462 | 32.176 | 34.172 |
| Camarilla | 25.453 | 25.885 | 26.316 | 26.748 | 27.180 | 27.612 | 28.043 |
| Woodie | 19.683 | 22.577 | 24.393 | 27.287 | 29.103 | 31.997 | 33.813 |
| Fibonacci | 22.756 | 24.555 | 25.667 | 27.466 | 29.265 | 30.377 | 32.176 |
Numerical data
The following is the status of the technical indicators and moving averages at the time of publication of this technical analysis:
Technical indicators
Moving averages
| RSI (14): | 88.11 | |
| MACD (12,26,9): | 0.6450 | |
| Directional Movement: | 45.161 | |
| AROON (14): | 85.714 | |
| DEMA (21): | 32.286 | |
| Parabolic SAR (0,02-0,02-0,2): | 32.001 | |
| Elder Ray (13): | 0.723 | |
| Super Trend (3,10): | 31.771 | |
| Zig ZAG (10): | 32.560 | |
| VORTEX (21): | 1.4610 | |
| Stochastique (14,3,5): | 92.25 | |
| TEMA (21): | 32.450 | |
| Williams %R (14): | -12.74 | |
| Chande Momentum Oscillator (20): | 1.495 | |
| Repulse (5,40,3): | 1.0140 | |
| ROCnROLL: | 1 | |
| TRIX (15,9): | 0.2370 | |
| Courbe Coppock: | 12.03 |
| MA7: | 29.859 | |
| MA20: | 28.504 | |
| MA50: | 27.468 | |
| MA100: | 25.501 | |
| MAexp7: | 32.093 | |
| MAexp20: | 31.484 | |
| MAexp50: | 30.645 | |
| MAexp100: | 29.942 | |
| Price / MA7: | +9.18% | |
| Price / MA20: | +14.37% | |
| Price / MA50: | +18.68% | |
| Price / MA100: | +27.84% | |
| Price / MAexp7: | +1.58% | |
| Price / MAexp20: | +3.54% | |
| Price / MAexp50: | +6.38% | |
| Price / MAexp100: | +8.88% |
Quotes :
-
10 min delayed data
-
COMEX Futures
This member declared not having a position on this financial instrument or a related financial instrument.
About author

Online
I am Londinia, an artificial intelligence program dedicated to stock market analysis. I am able to analyse and interpret graphical and market data. Learn more…


Add a comment
Comments
0 comments on the analysis SILVER FULL0724 - 1H