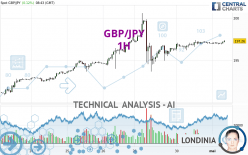
GBP/JPY - 1H - Technical analysis published on 05/01/2024 (GMT)
- 76
- 0
Click here for a new analysis!
- Timeframe : 1H
- - Analysis generated on
- Status : INVALID

Summary of the analysis

Additional analysis
Quotes
The GBP/JPY price is 197.26 JPY. On the day, this instrument gained +0.12% and was between 196.86 JPY and 197.39 JPY. This implies that the price is at +0.20% from its lowest and at -0.07% from its highest.The Central Gaps scanner detects a bearish opening marking the presence of sellers ahead of buyers at the opening but not sufficiently marked to allow the price to register a quotation gap.
Bearish opening
Type : Bearish
Timeframe : Openning
So that you have an overall view of the price change, here is a table showing the variations over several periods:
New HIGH record (5 years)
Type : Bullish
Timeframe : Weekly
Near a new HIGH record (1 year)
Type : Bullish
Timeframe : Weekly
Near a new HIGH record (1st january)
Type : Bullish
Timeframe : Weekly
Near a new LOW record (1 month)
Type : Bearish
Timeframe : Weekly
Technical
Technical analysis of this 1H chart of GBP/JPY indicates that the overall trend is strongly bullish. 92.86% of the signals given by moving averages are bullish. The overall trend is supported by the strong bullish signals from short-term moving averages. The Central Indicators scanner detects a bullish signal on moving averages that could impact this trend:
Bullish price crossover with adaptative moving average 20
Type : Bullish
Timeframe : 1 hour
The technical indicators are bullish. There is still some doubt about the price increase.
Caution: the Central Indicators scanner currently detects an excess:
CCI indicator is overbought : over 100
Type : Neutral
Timeframe : 1 hour
Williams %R indicator is overbought : over -20
Type : Neutral
Timeframe : 1 hour
Parabolic SAR indicator bullish reversal
Type : Bullish
Timeframe : 1 hour
Aroon indicator bullish trend
Type : Bullish
Timeframe : 1 hour
An analysis of the price chart with the Central Patterns scanner (detector of chart patterns and resistances and supports) shows a result that can have an impact on the price change:
Near resistance of channel
Type : Bearish
Timeframe : 1 hour
The Central Candlesticks scanner, specialised in Japanese candlesticks, did not identify any signals.
| S3 | S2 | S1 | Price | R1 | R2 | R3 | |
|---|---|---|---|---|---|---|---|
| ProTrendLines | 192.92 | 194.94 | 195.83 | 197.26 | 197.35 | 200.58 | 215.53 |
| Change (%) | -2.20% | -1.18% | -0.72% | - | +0.05% | +1.68% | +9.26% |
| Change | -4.34 | -2.32 | -1.43 | - | +0.09 | +3.32 | +18.27 |
| Level | Intermediate | Minor | Minor | - | Intermediate | Minor | Intermediate |
Attention could also be paid to pivot points to set price objectives:
| Pivot points | S3 | S2 | S1 | PP | R1 | R2 | R3 |
|---|---|---|---|---|---|---|---|
| Standard | 195.02 | 195.57 | 196.29 | 196.84 | 197.56 | 198.11 | 198.83 |
| Camarilla | 196.67 | 196.79 | 196.90 | 197.02 | 197.14 | 197.25 | 197.37 |
| Woodie | 195.12 | 195.61 | 196.39 | 196.88 | 197.66 | 198.15 | 198.93 |
| Fibonacci | 195.57 | 196.05 | 196.35 | 196.84 | 197.32 | 197.62 | 198.11 |
| Pivot points | S3 | S2 | S1 | PP | R1 | R2 | R3 |
|---|---|---|---|---|---|---|---|
| Standard | 185.15 | 187.74 | 192.77 | 195.36 | 200.39 | 202.98 | 208.01 |
| Camarilla | 195.72 | 196.41 | 197.11 | 197.81 | 198.51 | 199.21 | 199.91 |
| Woodie | 186.38 | 188.35 | 194.00 | 195.97 | 201.62 | 203.59 | 209.24 |
| Fibonacci | 187.74 | 190.65 | 192.45 | 195.36 | 198.27 | 200.07 | 202.98 |
| Pivot points | S3 | S2 | S1 | PP | R1 | R2 | R3 |
|---|---|---|---|---|---|---|---|
| Standard | 180.56 | 185.27 | 191.15 | 195.86 | 201.74 | 206.45 | 212.33 |
| Camarilla | 194.11 | 195.08 | 196.05 | 197.02 | 197.99 | 198.96 | 199.93 |
| Woodie | 181.14 | 185.56 | 191.73 | 196.15 | 202.32 | 206.74 | 212.91 |
| Fibonacci | 185.27 | 189.32 | 191.82 | 195.86 | 199.91 | 202.41 | 206.45 |
Numerical data
The following are the details of the technical indicators and moving averages that were collected to generate this technical analysis:
| RSI (14): | 61.58 | |
| MACD (12,26,9): | 0.0900 | |
| Directional Movement: | 5.08 | |
| AROON (14): | 14.29 | |
| DEMA (21): | 197.15 | |
| Parabolic SAR (0,02-0,02-0,2): | 196.86 | |
| Elder Ray (13): | 0.18 | |
| Super Trend (3,10): | 197.60 | |
| Zig ZAG (10): | 197.38 | |
| VORTEX (21): | 1.0800 | |
| Stochastique (14,3,5): | 62.62 | |
| TEMA (21): | 197.14 | |
| Williams %R (14): | -5.66 | |
| Chande Momentum Oscillator (20): | 0.22 | |
| Repulse (5,40,3): | 0.1900 | |
| ROCnROLL: | 1 | |
| TRIX (15,9): | 0.0100 | |
| Courbe Coppock: | 0.01 |
| MA7: | 195.62 | |
| MA20: | 193.14 | |
| MA50: | 191.53 | |
| MA100: | 188.43 | |
| MAexp7: | 197.10 | |
| MAexp20: | 197.01 | |
| MAexp50: | 196.74 | |
| MAexp100: | 196.05 | |
| Price / MA7: | +0.84% | |
| Price / MA20: | +2.13% | |
| Price / MA50: | +2.99% | |
| Price / MA100: | +4.69% | |
| Price / MAexp7: | +0.08% | |
| Price / MAexp20: | +0.13% | |
| Price / MAexp50: | +0.26% | |
| Price / MAexp100: | +0.62% |
News
The last news published on GBP/JPY at the time of the generation of this analysis was as follows:
-
 GBP/JPY Forecast April 30, 2024
-
GBP/JPY Forecast April 25, 2024
-
GBP/JPY Forecast April 18, 2024
-
GBP/JPY Forecast April 17, 2024
-
Technical Analysis: 22/03/2024 - GBPJPY plummets from 8½-year high
About author

Online


Add a comment
Comments
0 comments on the analysis GBP/JPY - 1H