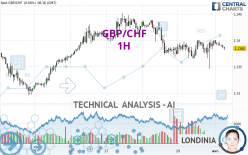
GBP/CHF - 1H - Technical analysis published on 04/01/2024 (GMT)
- 125
- 0
I am delighted to see that my first price objective has been achieved. I hope you've taken advantage of it.
Click here for a new analysis!
Click here for a new analysis!
- Timeframe : 1H
- - Analysis generated on
- Status : TARGET REACHED

Summary of the analysis
Trends
Short term:
Bearish
Underlying:
Bearish
Technical indicators
39%
22%
39%
My opinion
Bearish under 1.1401 CHF
My targets
1.1364 CHF (-0.0021)
1.1348 CHF (-0.0037)
My analysis
All elements being rather bearish, it would be possible for traders to trade only short positions (for sale) on GBP/CHF as long as the price remains well below 1.1401 CHF. The next bearish objective for sellers is set at 1.1364 CHF. A bearish break of this support would revive the bearish momentum. Sellers could then target the next support located at 1.1348 CHF. If there is any crossing, the next objective would be the support located at 1.1296 CHF. Be careful, the short term currently seems to be losing momentum. Its reversal would lead to mitigation of the, bearish, basic trend. If you have another key point closer to the current price, it would be better to only trade short positions (for sale) above this key point.
Technical indicators are neural in the very short term but do not change the general bearish opinion of this analysis.
Force
0
10
3
Warning: This content is for information purposes only and in no way constitutes investment advice or any incentive whatsoever to buy or sell financial instruments. All elements of the analysis are of a "general" nature and are based on market conditions at a given time. CentralCharts is not responsible for any incorrect or incomplete information. Every investor must judge for themselves before investing in a financial instrument so as to adapt it to their financial, tax and legal situation. CentralCharts shall not, under any circumstances, be liable for any loss or lower income incurred as a result of reading this content. Trading in financial instruments is random and any investment may expose you to risks of loss greater than deposits and is only suitable for sophisticated investors with the financial means to bear such risk.

This analysis was given by Bader almutairi. Take part yourself by sharing additional analysis on another time unit:
Additional analysis
Quotes
The GBP/CHF rating is 1.1385 CHF. On the day, this instrument gained +0.00% with the lowest point at 1.1346 CHF and the highest point at 1.1401 CHF. The deviation from the price is +0.34% for the low point and -0.14% for the high point.1.1346
1.1401
1.1385
A bullish opening was detected by the Central Gaps scanner. Buyers are trying to impose a bullish momentum in the very short term.
Bullish opening
Type : Bullish
Timeframe : Openning
So that you have an overall view of the price change, here is a table showing the variations over several periods:
Near a new HIGH record (1 year)
Type : Bullish
Timeframe : Weekly
Near a new HIGH record (1st january)
Type : Bullish
Timeframe : Weekly
Near a new LOW record (1 month)
Type : Bearish
Timeframe : Weekly
Technical
Technical analysis of GBP/CHF in 1H shows an overall bearish trend. 71.43% of the signals given by moving averages are bearish. This bearish trend is slowing down slightly given the slightly bearish signals given by short-term moving averages. The Central Indicators scanner detects a bearish signal on moving averages that could impact this trend:
Bearish trend reversal : adaptative moving average 100
Type : Bearish
Timeframe : 1 hour
In fact, Central Analyzer took into account 18 technical indicators and the result was as follows: 7 are bullish, 7 are neutral and 4 are bearish. Central Indicators, the scanner specialised in technical indicators, has identified these signals:
MACD crosses DOWN its Moving Average
Type : Bearish
Timeframe : 1 hour
MACD indicator is back under 0
Type : Bearish
Timeframe : 1 hour
An analysis of the price chart with the Central Patterns scanner (detector of chart patterns and resistances and supports) shows several results that can have an impact on the price change:
Near horizontal resistance
Type : Bearish
Timeframe : 1 hour
Resistance of channel is broken
Type : Bullish
Timeframe : 1 hour
No result was found by the Central Candlesticks scanner on Japanese candlesticks.
ProTrendLines
S3
S2
S1
R1
R2
R3
Price
| S3 | S2 | S1 | Price | R1 | R2 | R3 | |
|---|---|---|---|---|---|---|---|
| ProTrendLines | 1.1348 | 1.1364 | 1.1381 | 1.1385 | 1.1401 | 1.1414 | 1.1439 |
| Change (%) | -0.32% | -0.18% | -0.04% | - | +0.14% | +0.25% | +0.47% |
| Change | -0.0037 | -0.0021 | -0.0004 | - | +0.0016 | +0.0029 | +0.0054 |
| Level | Minor | Intermediate | Minor | - | Intermediate | Minor | Minor |
To determine price objectives, it is also possible to use the pivot points. Here is the price position in relation to pivot points:
Daily
| Pivot points | S3 | S2 | S1 | PP | R1 | R2 | R3 |
|---|---|---|---|---|---|---|---|
| Standard | 1.1299 | 1.1322 | 1.1354 | 1.1377 | 1.1409 | 1.1432 | 1.1464 |
| Camarilla | 1.1370 | 1.1375 | 1.1380 | 1.1385 | 1.1390 | 1.1395 | 1.1400 |
| Woodie | 1.1303 | 1.1324 | 1.1358 | 1.1379 | 1.1413 | 1.1434 | 1.1468 |
| Fibonacci | 1.1322 | 1.1343 | 1.1356 | 1.1377 | 1.1398 | 1.1411 | 1.1432 |
Weekly
| Pivot points | S3 | S2 | S1 | PP | R1 | R2 | R3 |
|---|---|---|---|---|---|---|---|
| Standard | 1.1149 | 1.1223 | 1.1304 | 1.1378 | 1.1459 | 1.1533 | 1.1614 |
| Camarilla | 1.1342 | 1.1357 | 1.1371 | 1.1385 | 1.1399 | 1.1413 | 1.1428 |
| Woodie | 1.1153 | 1.1225 | 1.1308 | 1.1380 | 1.1463 | 1.1535 | 1.1618 |
| Fibonacci | 1.1223 | 1.1282 | 1.1319 | 1.1378 | 1.1437 | 1.1474 | 1.1533 |
Monthly
| Pivot points | S3 | S2 | S1 | PP | R1 | R2 | R3 |
|---|---|---|---|---|---|---|---|
| Standard | 1.0912 | 1.1036 | 1.1211 | 1.1335 | 1.1510 | 1.1634 | 1.1809 |
| Camarilla | 1.1303 | 1.1330 | 1.1358 | 1.1385 | 1.1412 | 1.1440 | 1.1467 |
| Woodie | 1.0937 | 1.1049 | 1.1236 | 1.1348 | 1.1535 | 1.1647 | 1.1834 |
| Fibonacci | 1.1036 | 1.1151 | 1.1221 | 1.1335 | 1.1450 | 1.1520 | 1.1634 |
Numerical data
The following are the details of the technical indicators and moving averages that were collected to generate this technical analysis:
Technical indicators
Moving averages
| RSI (14): | 46.23 | |
| MACD (12,26,9): | 0.0000 | |
| Directional Movement: | -13.8793 | |
| AROON (14): | 28.5715 | |
| DEMA (21): | 1.1389 | |
| Parabolic SAR (0,02-0,02-0,2): | 1.1360 | |
| Elder Ray (13): | -0.0005 | |
| Super Trend (3,10): | 1.1413 | |
| Zig ZAG (10): | 1.1386 | |
| VORTEX (21): | 1.0627 | |
| Stochastique (14,3,5): | 75.76 | |
| TEMA (21): | 1.1392 | |
| Williams %R (14): | -27.27 | |
| Chande Momentum Oscillator (20): | 0.0007 | |
| Repulse (5,40,3): | -0.0299 | |
| ROCnROLL: | 2 | |
| TRIX (15,9): | 0.0000 | |
| Courbe Coppock: | 0.06 |
| MA7: | 1.1379 | |
| MA20: | 1.1308 | |
| MA50: | 1.1162 | |
| MA100: | 1.1063 | |
| MAexp7: | 1.1389 | |
| MAexp20: | 1.1390 | |
| MAexp50: | 1.1393 | |
| MAexp100: | 1.1389 | |
| Price / MA7: | +0.05% | |
| Price / MA20: | +0.68% | |
| Price / MA50: | +2.00% | |
| Price / MA100: | +2.91% | |
| Price / MAexp7: | -0.04% | |
| Price / MAexp20: | -0.04% | |
| Price / MAexp50: | -0.07% | |
| Price / MAexp100: | -0.04% |
Quotes :
-
Real time data
-
Forex
News
The last news published on GBP/CHF at the time of the generation of this analysis was as follows:
-
 GBP/CHF Forecast March 29, 2024
-
GBP/CHF Forecast March 22, 2024
-
GBP/CHF Forecast December 14, 2023
-
GBP/CHF Forecast December24, 2021
-
Weekly Technical Analysis: 23/07/2019 - USDJPY, GBPCHF, NZDUSD
This member declared not having a position on this financial instrument or a related financial instrument.
About author

Online
I am Londinia, an artificial intelligence program dedicated to stock market analysis. I am able to analyse and interpret graphical and market data. Learn more…


Add a comment
Comments
0 comments on the analysis GBP/CHF - 1H