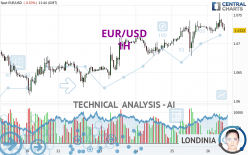
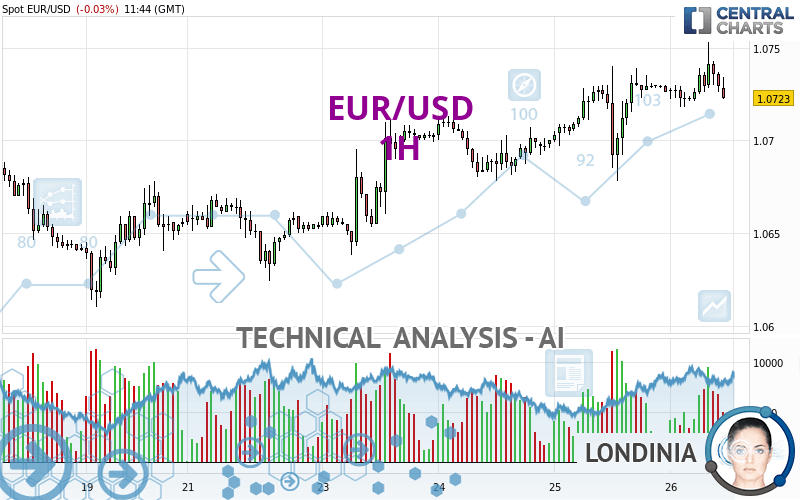
EUR/USD - 1H - Technical analysis published on 04/26/2024 (GMT)
- 80
- 0
Click here for a new analysis!
- Timeframe : 1H
- - Analysis generated on
- Status : INVALID
Summary of the analysis

Additional analysis
Quotes
The EUR/USD rating is 1.0723 USD. On the day, this instrument lost -0.03% and was between 1.0718 USD and 1.0753 USD. This implies that the price is at +0.05% from its lowest and at -0.28% from its highest.The Central Gaps scanner detects a bullish opening marking the presence of buyers ahead of sellers at the opening but not sufficiently marked to allow the price to register a quotation gap.
Bullish opening
Type : Bullish
Timeframe : Openning
A study of price movements over other periods shows the following variations:
Near a new HIGH record (1 year)
Type : Bullish
Timeframe : Weekly
Near a new HIGH record (1st january)
Type : Bullish
Timeframe : Weekly
Near a new HIGH record (1 month)
Type : Bullish
Timeframe : Weekly
Technical
Technical analysis of this 1H chart of EUR/USD indicates that the overall trend is bullish. 78.57% of the signals given by moving averages are bullish. Caution: the neutral signals currently given by short-term moving averages show us that the global trend is losing momentum. The Central Indicators scanner detects bearish signals on moving averages that could impact this trend:
Bearish price crossover with Moving Average 20
Type : Bearish
Timeframe : 1 hour
Bearish price crossover with adaptative moving average 20
Type : Bearish
Timeframe : 1 hour
In fact, of the 18 technical indicators analysed by Central Analyzer, 4 are bullish, 9 are neutral and 5 are bearish. Caution: the Central Indicators scanner currently detects an excess:
Williams %R indicator is oversold : under -80
Type : Neutral
Timeframe : 1 hour
Pivot points : price is over resistance 1
Type : Neutral
Timeframe : Weekly
RSI indicator is back under 50
Type : Bearish
Timeframe : 1 hour
An analysis of the price chart with the Central Patterns scanner (detector of chart patterns and resistances and supports) shows several results that can have an impact on the price change:
Near horizontal resistance
Type : Bearish
Timeframe : 1 hour
Resistance of channel is broken
Type : Bullish
Timeframe : 1 hour
Central Candlesticks, the scanner specialised in Japanese candlesticks, detects this inversion signal that could impact the current short-term trend:
Doji
Type : Neutral
Timeframe : 1 hour
| S3 | S2 | S1 | Price | R1 | R2 | R3 | |
|---|---|---|---|---|---|---|---|
| ProTrendLines | 1.0654 | 1.0678 | 1.0708 | 1.0723 | 1.0740 | 1.0862 | 1.0950 |
| Change (%) | -0.64% | -0.42% | -0.14% | - | +0.16% | +1.30% | +2.12% |
| Change | -0.0069 | -0.0045 | -0.0015 | - | +0.0017 | +0.0139 | +0.0227 |
| Level | Minor | Major | Intermediate | - | Intermediate | Minor | Intermediate |
Attention could also be paid to pivot points to set price objectives:
| Pivot points | S3 | S2 | S1 | PP | R1 | R2 | R3 |
|---|---|---|---|---|---|---|---|
| Standard | 1.0627 | 1.0653 | 1.0689 | 1.0715 | 1.0751 | 1.0777 | 1.0813 |
| Camarilla | 1.0709 | 1.0715 | 1.0720 | 1.0726 | 1.0732 | 1.0737 | 1.0743 |
| Woodie | 1.0633 | 1.0656 | 1.0695 | 1.0718 | 1.0757 | 1.0780 | 1.0819 |
| Fibonacci | 1.0653 | 1.0676 | 1.0691 | 1.0715 | 1.0738 | 1.0753 | 1.0777 |
| Pivot points | S3 | S2 | S1 | PP | R1 | R2 | R3 |
|---|---|---|---|---|---|---|---|
| Standard | 1.0519 | 1.0560 | 1.0608 | 1.0649 | 1.0697 | 1.0738 | 1.0786 |
| Camarilla | 1.0632 | 1.0640 | 1.0648 | 1.0656 | 1.0664 | 1.0672 | 1.0681 |
| Woodie | 1.0523 | 1.0562 | 1.0612 | 1.0651 | 1.0701 | 1.0740 | 1.0790 |
| Fibonacci | 1.0560 | 1.0594 | 1.0615 | 1.0649 | 1.0683 | 1.0704 | 1.0738 |
| Pivot points | S3 | S2 | S1 | PP | R1 | R2 | R3 |
|---|---|---|---|---|---|---|---|
| Standard | 1.0498 | 1.0633 | 1.0712 | 1.0847 | 1.0926 | 1.1061 | 1.1140 |
| Camarilla | 1.0733 | 1.0753 | 1.0772 | 1.0792 | 1.0812 | 1.0831 | 1.0851 |
| Woodie | 1.0471 | 1.0619 | 1.0685 | 1.0833 | 1.0899 | 1.1047 | 1.1113 |
| Fibonacci | 1.0633 | 1.0714 | 1.0765 | 1.0847 | 1.0928 | 1.0979 | 1.1061 |
Numerical data
The following is the status of the technical indicators and moving averages at the time of publication of this technical analysis:
| RSI (14): | 54.06 | |
| MACD (12,26,9): | 0.0004 | |
| Directional Movement: | 10.5101 | |
| AROON (14): | 42.8571 | |
| DEMA (21): | 1.0734 | |
| Parabolic SAR (0,02-0,02-0,2): | 1.0701 | |
| Elder Ray (13): | 0.0002 | |
| Super Trend (3,10): | 1.0707 | |
| Zig ZAG (10): | 1.0729 | |
| VORTEX (21): | 1.1813 | |
| Stochastique (14,3,5): | 37.14 | |
| TEMA (21): | 1.0732 | |
| Williams %R (14): | -85.71 | |
| Chande Momentum Oscillator (20): | -0.0001 | |
| Repulse (5,40,3): | -0.1110 | |
| ROCnROLL: | -1 | |
| TRIX (15,9): | 0.0071 | |
| Courbe Coppock: | 0.06 |
| MA7: | 1.0686 | |
| MA20: | 1.0728 | |
| MA50: | 1.0805 | |
| MA100: | 1.0844 | |
| MAexp7: | 1.0729 | |
| MAexp20: | 1.0727 | |
| MAexp50: | 1.0716 | |
| MAexp100: | 1.0700 | |
| Price / MA7: | +0.35% | |
| Price / MA20: | -0.05% | |
| Price / MA50: | -0.76% | |
| Price / MA100: | -1.12% | |
| Price / MAexp7: | -0.06% | |
| Price / MAexp20: | -0.04% | |
| Price / MAexp50: | +0.07% | |
| Price / MAexp100: | +0.21% |
News
The latest news and videos published on EUR/USD at the time of the analysis were as follows:
-
 EUR/USD Daily Forecast and Technical Analysis for April 25, 2024, by Chris Lewis for FX Empire
-
EUR/USD Forecast April 26, 2024
-
EUR/USD Daily Forecast and Technical Analysis for April 24, 2024, by Chris Lewis for FX Empire
-
Trading the trend: Is it time to short EURUSD?
-
EUR/USD Forecast April 24, 2024
About author

Online


Add a comment
Comments
0 comments on the analysis EUR/USD - 1H