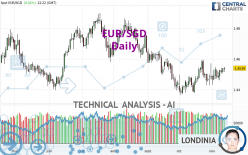
EUR/SGD - Daily - Technical analysis published on 11/13/2023 (GMT)
- 124
- 0
- Timeframe : Daily
- - Analysis generated on
- Status : NEUTRAL

Summary of the analysis
Trends
Short term:
Bullish
Underlying:
Slightly bearish
Technical indicators
83%
0%
17%
My opinion
Neutral between 1.4419 SGD and 1.4609 SGD
My targets
-
My analysis
The basic trend is slightly bearish and the short term is tentatively bullish. With such a pattern, it is difficult to favour buying or selling. The first resistance is located at 1.4609 SGD. The first support is located at 1.4419 SGD. Without a basic trend, it is be important to monitor the price reaction at the first levels of resistance or support. A bullish break in resistance could quickly reverse the basic trend. A bearish break in the support would be welcome to boost the slightly bearish basic trend. On the other hand, if the price is blocked by resistance or support, it could be attractive to trade against the trend on the last short-term movement registered by EUR/SGD.
Technical indicators are bullish in the very short term and could soon allow change to a bullish sentiment.
Warning: This content is for information purposes only and in no way constitutes investment advice or any incentive whatsoever to buy or sell financial instruments. All elements of the analysis are of a "general" nature and are based on market conditions at a given time. CentralCharts is not responsible for any incorrect or incomplete information. Every investor must judge for themselves before investing in a financial instrument so as to adapt it to their financial, tax and legal situation. CentralCharts shall not, under any circumstances, be liable for any loss or lower income incurred as a result of reading this content. Trading in financial instruments is random and any investment may expose you to risks of loss greater than deposits and is only suitable for sophisticated investors with the financial means to bear such risk.

This analysis was given by hannahfreeman. Take part yourself by sharing additional analysis on another time unit:
Additional analysis
Quotes
The EUR/SGD price is 1.4539 SGD. On the day, this instrument gained +0.02% and was between 1.4515 SGD and 1.4548 SGD. This implies that the price is at +0.17% from its lowest and at -0.06% from its highest.1.4515
1.4548
1.4539
The Central Gaps scanner detects a bearish opening marking the presence of sellers ahead of buyers at the opening but not sufficiently marked to allow the price to register a quotation gap.
Bearish opening
Type : Bearish
Timeframe : Openning
So that you have an overall view of the price change, here is a table showing the variations over several periods:
Near a new LOW record (1 year)
Type : Bearish
Timeframe : Weekly
Near a new LOW record (1st january)
Type : Bearish
Timeframe : Weekly
Near a new LOW record (1 month)
Type : Bearish
Timeframe : Weekly
Technical
A technical analysis in Daily of this EUR/SGD chart shows a slightly bearish trend. 53.57% of the signals given by moving averages are bearish. Caution: the slightly bullish signals currently given by short-term moving averages could cause a reversal of the trend. An assessment of moving averages reveals several bullish signals that could impact this trend:
Moving Average bullish crossovers : MA20 & MA50
Type : Bullish
Timeframe : Daily
Bullish price crossover with adaptative moving average 50
Type : Bullish
Timeframe : Daily
Technical indicators are strongly bullish, suggesting that the price increase should continue.
The Central Indicators scanner found no further results concerning independent technical indicators.
An analysis of the price chart with the Central Patterns scanner (detector of chart patterns and resistances and supports) shows several results that can have an impact on the price change:
Near horizontal resistance
Type : Bearish
Timeframe : Daily
Near resistance of channel
Type : Bearish
Timeframe : Daily
Resistance of triangle is broken
Type : Bullish
Timeframe : Daily
No result was found by the Central Candlesticks scanner on Japanese candlesticks.
ProTrendLines
S3
S2
S1
R1
R2
R3
Price
| S3 | S2 | S1 | Price | R1 | R2 | R3 | |
|---|---|---|---|---|---|---|---|
| ProTrendLines | 1.4204 | 1.4296 | 1.4419 | 1.4539 | 1.4609 | 1.4683 | 1.4745 |
| Change (%) | -2.30% | -1.67% | -0.83% | - | +0.48% | +0.99% | +1.42% |
| Change | -0.0335 | -0.0243 | -0.0120 | - | +0.0070 | +0.0144 | +0.0206 |
| Level | Intermediate | Minor | Major | - | Intermediate | Minor | Intermediate |
To determine price objectives, it is also possible to use the pivot points. Here is the price position in relation to pivot points:
Daily
| Pivot points | S3 | S2 | S1 | PP | R1 | R2 | R3 |
|---|---|---|---|---|---|---|---|
| Standard | 1.4482 | 1.4494 | 1.4515 | 1.4527 | 1.4548 | 1.4560 | 1.4581 |
| Camarilla | 1.4527 | 1.4530 | 1.4533 | 1.4536 | 1.4539 | 1.4542 | 1.4545 |
| Woodie | 1.4487 | 1.4496 | 1.4520 | 1.4529 | 1.4553 | 1.4562 | 1.4586 |
| Fibonacci | 1.4494 | 1.4507 | 1.4514 | 1.4527 | 1.4540 | 1.4547 | 1.4560 |
Weekly
| Pivot points | S3 | S2 | S1 | PP | R1 | R2 | R3 |
|---|---|---|---|---|---|---|---|
| Standard | 1.4400 | 1.4431 | 1.4483 | 1.4514 | 1.4566 | 1.4597 | 1.4649 |
| Camarilla | 1.4513 | 1.4521 | 1.4528 | 1.4536 | 1.4544 | 1.4551 | 1.4559 |
| Woodie | 1.4412 | 1.4436 | 1.4495 | 1.4519 | 1.4578 | 1.4602 | 1.4661 |
| Fibonacci | 1.4431 | 1.4462 | 1.4482 | 1.4514 | 1.4545 | 1.4565 | 1.4597 |
Monthly
| Pivot points | S3 | S2 | S1 | PP | R1 | R2 | R3 |
|---|---|---|---|---|---|---|---|
| Standard | 1.4138 | 1.4251 | 1.4369 | 1.4482 | 1.4600 | 1.4713 | 1.4831 |
| Camarilla | 1.4425 | 1.4446 | 1.4467 | 1.4488 | 1.4509 | 1.4530 | 1.4552 |
| Woodie | 1.4142 | 1.4252 | 1.4373 | 1.4483 | 1.4604 | 1.4714 | 1.4835 |
| Fibonacci | 1.4251 | 1.4339 | 1.4393 | 1.4482 | 1.4570 | 1.4624 | 1.4713 |
Numerical data
The following is the status of the technical indicators and moving averages at the time of publication of this technical analysis:
Technical indicators
Moving averages
| RSI (14): | 55.45 | |
| MACD (12,26,9): | 0.0007 | |
| Directional Movement: | 8.8114 | |
| AROON (14): | -14.2857 | |
| DEMA (21): | 1.4506 | |
| Parabolic SAR (0,02-0,02-0,2): | 1.4558 | |
| Elder Ray (13): | 0.0024 | |
| Super Trend (3,10): | 1.4590 | |
| Zig ZAG (10): | 1.4536 | |
| VORTEX (21): | 1.0984 | |
| Stochastique (14,3,5): | 65.71 | |
| TEMA (21): | 1.4531 | |
| Williams %R (14): | -21.53 | |
| Chande Momentum Oscillator (20): | 0.0081 | |
| Repulse (5,40,3): | 0.3358 | |
| ROCnROLL: | 1 | |
| TRIX (15,9): | 0.0009 | |
| Courbe Coppock: | 0.21 |
| MA7: | 1.4516 | |
| MA20: | 1.4503 | |
| MA50: | 1.4503 | |
| MA100: | 1.4621 | |
| MAexp7: | 1.4518 | |
| MAexp20: | 1.4502 | |
| MAexp50: | 1.4523 | |
| MAexp100: | 1.4551 | |
| Price / MA7: | +0.16% | |
| Price / MA20: | +0.25% | |
| Price / MA50: | +0.25% | |
| Price / MA100: | -0.56% | |
| Price / MAexp7: | +0.14% | |
| Price / MAexp20: | +0.26% | |
| Price / MAexp50: | +0.11% | |
| Price / MAexp100: | -0.08% |
Quotes :
-
Real time data
-
Forex
This member declared not having a position on this financial instrument or a related financial instrument.
About author

Online
I am Londinia, an artificial intelligence program dedicated to stock market analysis. I am able to analyse and interpret graphical and market data. Learn more…


Add a comment
Comments
0 comments on the analysis EUR/SGD - Daily