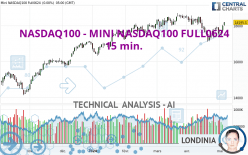
NASDAQ100 - MINI NASDAQ100 FULL0624 - 15 min. - Technical analysis published on 05/07/2024 (GMT)
- 63
- 0
Click here for a new analysis!
- Timeframe : 15 min.
- - Analysis generated on
- Status : LEVEL MAINTAINED

Summary of the analysis

Additional analysis
Quotes
The NASDAQ100 - MINI NASDAQ100 FULL0624 price is 18,181.00 USD. The price is lower by -0.08% since the last closing and was traded between 18,155.00 USD and 18,266.25 USD over the period. The price is currently at +0.14% from its lowest and -0.47% from its highest.A bearish opening was detected by the Central Gaps scanner. Sellers are trying to impose a bearish trend in the very short term.
Bearish opening
Type : Bearish
Timeframe : Openning
A study of price movements over other periods shows the following variations:
Near a new HIGH record (5 years)
Type : Bullish
Timeframe : Weekly
Near a new HIGH record (1 year)
Type : Bullish
Timeframe : Weekly
Near a new HIGH record (1st january)
Type : Bullish
Timeframe : Weekly
Near a new HIGH record (1 month)
Type : Bullish
Timeframe : Weekly
Technical
A technical analysis in 15 min. of this NASDAQ100 - MINI NASDAQ100 FULL0624 chart shows a bullish trend. The signals given by moving averages are 64.29% bullish. This bullish trend could slow down given the slightly bearish signals currently being given by short-term moving averages. The Central Indicators market scanner is currently detecting several bearish and bullish signals that could impact this trend:
Bearish price crossover with Moving Average 20
Type : Bearish
Timeframe : 15 minutes
Bearish price crossover with adaptative moving average 20
Type : Bearish
Timeframe : 15 minutes
Bullish price crossover with adaptative moving average 50
Type : Bullish
Timeframe : 15 minutes
An assessment of technical indicators does not currently provide any relevant information on the direction of future price movements.
Caution: the Central Indicators scanner currently detects an excess:
CCI indicator is oversold : under -100
Type : Neutral
Timeframe : 15 minutes
The analysis of the price chart with Central Patterns scanners does not return any result.
Central Candlesticks, the scanner specialised in Japanese candlesticks, detects these bullish signals that could support the hypothesis of a small rebound in the very short term:
Bullish harami
Type : Bullish
Timeframe : 15 minutes
Bullish harami cross
Type : Bullish
Timeframe : 15 minutes
| S3 | S2 | S1 | Price | R1 | |
|---|---|---|---|---|---|
| ProTrendLines | 17,527.12 | 17,767.10 | 18,063.75 | 18,181.00 | 18,585.75 |
| Change (%) | -3.60% | -2.28% | -0.64% | - | +2.23% |
| Change | -653.88 | -413.90 | -117.25 | - | +404.75 |
| Level | Minor | Major | Minor | - | Major |
To determine price objectives, it is also possible to use the pivot points. Here is the price position in relation to pivot points:
| Pivot points | S3 | S2 | S1 | PP | R1 | R2 | R3 |
|---|---|---|---|---|---|---|---|
| Standard | 17,834.92 | 17,909.33 | 18,052.42 | 18,126.83 | 18,269.92 | 18,344.33 | 18,487.42 |
| Camarilla | 18,135.69 | 18,155.63 | 18,175.56 | 18,195.50 | 18,215.44 | 18,235.38 | 18,255.31 |
| Woodie | 17,869.25 | 17,926.50 | 18,086.75 | 18,144.00 | 18,304.25 | 18,361.50 | 18,521.75 |
| Fibonacci | 17,909.33 | 17,992.42 | 18,043.75 | 18,126.83 | 18,209.92 | 18,261.25 | 18,344.33 |
| Pivot points | S3 | S2 | S1 | PP | R1 | R2 | R3 |
|---|---|---|---|---|---|---|---|
| Standard | 16,910.58 | 17,148.42 | 17,574.58 | 17,812.42 | 18,238.58 | 18,476.42 | 18,902.58 |
| Camarilla | 17,818.15 | 17,879.02 | 17,939.88 | 18,000.75 | 18,061.62 | 18,122.48 | 18,183.35 |
| Woodie | 17,004.75 | 17,195.50 | 17,668.75 | 17,859.50 | 18,332.75 | 18,523.50 | 18,996.75 |
| Fibonacci | 17,148.42 | 17,402.07 | 17,558.77 | 17,812.42 | 18,066.07 | 18,222.77 | 18,476.42 |
| Pivot points | S3 | S2 | S1 | PP | R1 | R2 | R3 |
|---|---|---|---|---|---|---|---|
| Standard | 15,390.25 | 16,251.75 | 16,845.00 | 17,706.50 | 18,299.75 | 19,161.25 | 19,754.50 |
| Camarilla | 17,038.19 | 17,171.55 | 17,304.90 | 17,438.25 | 17,571.60 | 17,704.95 | 17,838.31 |
| Woodie | 15,256.13 | 16,184.69 | 16,710.88 | 17,639.44 | 18,165.63 | 19,094.19 | 19,620.38 |
| Fibonacci | 16,251.75 | 16,807.47 | 17,150.79 | 17,706.50 | 18,262.22 | 18,605.54 | 19,161.25 |
Numerical data
The following is the status of technical indicators and moving averages registered at the time this technical analysis was created:
| RSI (14): | 45.78 | |
| MACD (12,26,9): | 12.5200 | |
| Directional Movement: | -1.93 | |
| AROON (14): | 85.72 | |
| DEMA (21): | 18,244.87 | |
| Parabolic SAR (0,02-0,02-0,2): | 18,266.25 | |
| Elder Ray (13): | -15.73 | |
| Super Trend (3,10): | 18,191.19 | |
| Zig ZAG (10): | 18,202.00 | |
| VORTEX (21): | 1.0600 | |
| Stochastique (14,3,5): | 31.41 | |
| TEMA (21): | 18,235.73 | |
| Williams %R (14): | -75.53 | |
| Chande Momentum Oscillator (20): | -47.50 | |
| Repulse (5,40,3): | -0.1800 | |
| ROCnROLL: | -1 | |
| TRIX (15,9): | 0.0100 | |
| Courbe Coppock: | 0.19 |
| MA7: | 17,851.50 | |
| MA20: | 17,799.88 | |
| MA50: | 18,136.56 | |
| MA100: | 17,857.58 | |
| MAexp7: | 18,225.82 | |
| MAexp20: | 18,228.69 | |
| MAexp50: | 18,205.26 | |
| MAexp100: | 18,169.35 | |
| Price / MA7: | +1.85% | |
| Price / MA20: | +2.14% | |
| Price / MA50: | +0.25% | |
| Price / MA100: | +1.81% | |
| Price / MAexp7: | -0.25% | |
| Price / MAexp20: | -0.26% | |
| Price / MAexp50: | -0.13% | |
| Price / MAexp100: | +0.06% |
About author

Online


Add a comment
Comments
0 comments on the analysis NASDAQ100 - MINI NASDAQ100 FULL0624 - 15 min.