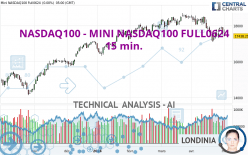
NASDAQ100 - MINI NASDAQ100 FULL0624 - 15 min. - Technical analysis published on 05/02/2024 (GMT)
- 71
- 0
Click here for a new analysis!
- Timeframe : 15 min.
- - Analysis generated on
- Status : INVALID

Summary of the analysis

Additional analysis
Quotes
NASDAQ100 - MINI NASDAQ100 FULL0624 rating 17,497.00 USD. The price has increased by +0.34% since the last closing and was traded between 17,487.00 USD and 17,619.75 USD over the period. The price is currently at +0.06% from its lowest and -0.70% from its highest.The Central Gaps scanner detects a bullish opening marking the presence of buyers ahead of sellers at the opening but not sufficiently marked to allow the price to register a quotation gap.
Bullish opening
Type : Bullish
Timeframe : Openning
A study of price movements over other periods shows the following variations:
Near a new HIGH record (5 years)
Type : Bullish
Timeframe : Weekly
Near a new LOW record (1 month)
Type : Bearish
Timeframe : Weekly
Technical
A technical analysis in 15 min. of this NASDAQ100 - MINI NASDAQ100 FULL0624 chart shows a slightly bullish trend. 57.14% of the signals given by moving averages are bullish. Caution: the strong bearish signals currently given by short-term moving averages indicate that a trend reversal may be taking place. The Central Indicators market scanner is currently detecting several bearish and bullish signals that could impact this trend:
Bearish trend reversal : Moving Average 20
Type : Bearish
Timeframe : 15 minutes
Bullish price crossover with adaptative moving average 20
Type : Bullish
Timeframe : 15 minutes
In fact, Central Analyzer took into account 18 technical indicators and the result was as follows: 4 are bullish, 8 are neutral and 6 are bearish. Caution: the Central Indicators scanner currently detects an excess:
CCI indicator is oversold : under -100
Type : Neutral
Timeframe : 15 minutes
RSI indicator is back under 50
Type : Bearish
Timeframe : 15 minutes
Parabolic SAR indicator bearish reversal
Type : Bearish
Timeframe : 15 minutes
Ichimoku : price is under the cloud
Type : Bearish
Timeframe : 15 minutes
SuperTrend indicator bearish reversal
Type : Bearish
Timeframe : 15 minutes
Price is back over the pivot point
Type : Bullish
Timeframe : 15 minutes
Price is back under the pivot point
Type : Bearish
Timeframe : Weekly
No signals are given by Central Patterns, a market scanner specialised in chart patterns, resistances and supports.
The presence of a bullish Japanese candlestick pattern detected by Central Candlesticks that could cause a very short term rebound was also detected:
Bullish engulfing lines
Type : Bullish
Timeframe : 15 minutes
| S3 | S2 | S1 | Price | R1 | R2 | R3 | |
|---|---|---|---|---|---|---|---|
| ProTrendLines | 17,180.75 | 17,307.94 | 17,401.33 | 17,497.00 | 17,525.40 | 17,668.00 | 17,767.10 |
| Change (%) | -1.81% | -1.08% | -0.55% | - | +0.16% | +0.98% | +1.54% |
| Change | -316.25 | -189.06 | -95.67 | - | +28.40 | +171.00 | +270.10 |
| Level | Major | Intermediate | Intermediate | - | Minor | Minor | Major |
To determine price objectives, it is also possible to use the pivot points. Here is the price position in relation to pivot points:
| Pivot points | S3 | S2 | S1 | PP | R1 | R2 | R3 |
|---|---|---|---|---|---|---|---|
| Standard | 16,899.92 | 17,149.58 | 17,293.92 | 17,543.58 | 17,687.92 | 17,937.58 | 18,081.92 |
| Camarilla | 17,329.90 | 17,366.02 | 17,402.13 | 17,438.25 | 17,474.37 | 17,510.48 | 17,546.60 |
| Woodie | 16,847.25 | 17,123.25 | 17,241.25 | 17,517.25 | 17,635.25 | 17,911.25 | 18,029.25 |
| Fibonacci | 17,149.58 | 17,300.09 | 17,393.08 | 17,543.58 | 17,694.09 | 17,787.08 | 17,937.58 |
| Pivot points | S3 | S2 | S1 | PP | R1 | R2 | R3 |
|---|---|---|---|---|---|---|---|
| Standard | 16,609.33 | 16,878.92 | 17,362.33 | 17,631.92 | 18,115.33 | 18,384.92 | 18,868.33 |
| Camarilla | 17,638.68 | 17,707.70 | 17,776.73 | 17,845.75 | 17,914.78 | 17,983.80 | 18,052.83 |
| Woodie | 16,716.25 | 16,932.38 | 17,469.25 | 17,685.38 | 18,222.25 | 18,438.38 | 18,975.25 |
| Fibonacci | 16,878.92 | 17,166.56 | 17,344.27 | 17,631.92 | 17,919.56 | 18,097.27 | 18,384.92 |
| Pivot points | S3 | S2 | S1 | PP | R1 | R2 | R3 |
|---|---|---|---|---|---|---|---|
| Standard | 15,390.25 | 16,251.75 | 16,845.00 | 17,706.50 | 18,299.75 | 19,161.25 | 19,754.50 |
| Camarilla | 17,038.19 | 17,171.55 | 17,304.90 | 17,438.25 | 17,571.60 | 17,704.95 | 17,838.31 |
| Woodie | 15,256.13 | 16,184.69 | 16,710.88 | 17,639.44 | 18,165.63 | 19,094.19 | 19,620.38 |
| Fibonacci | 16,251.75 | 16,807.47 | 17,150.79 | 17,706.50 | 18,262.22 | 18,605.54 | 19,161.25 |
Numerical data
The following is the status of technical indicators and moving averages registered at the time this technical analysis was created:
| RSI (14): | 48.51 | |
| MACD (12,26,9): | 5.2500 | |
| Directional Movement: | 6.60 | |
| AROON (14): | 7.14 | |
| DEMA (21): | 17,590.44 | |
| Parabolic SAR (0,02-0,02-0,2): | 17,558.50 | |
| Elder Ray (13): | -10.55 | |
| Super Trend (3,10): | 17,551.34 | |
| Zig ZAG (10): | 17,586.00 | |
| VORTEX (21): | 0.9900 | |
| Stochastique (14,3,5): | 27.91 | |
| TEMA (21): | 17,587.62 | |
| Williams %R (14): | -61.38 | |
| Chande Momentum Oscillator (20): | 1.25 | |
| Repulse (5,40,3): | -0.0100 | |
| ROCnROLL: | -1 | |
| TRIX (15,9): | 0.0100 | |
| Courbe Coppock: | 0.05 |
| MA7: | 17,647.54 | |
| MA20: | 17,822.12 | |
| MA50: | 18,141.42 | |
| MA100: | 17,820.90 | |
| MAexp7: | 17,577.33 | |
| MAexp20: | 17,579.87 | |
| MAexp50: | 17,564.29 | |
| MAexp100: | 17,558.84 | |
| Price / MA7: | -0.85% | |
| Price / MA20: | -1.82% | |
| Price / MA50: | -3.55% | |
| Price / MA100: | -1.82% | |
| Price / MAexp7: | -0.45% | |
| Price / MAexp20: | -0.47% | |
| Price / MAexp50: | -0.38% | |
| Price / MAexp100: | -0.35% |
About author

Online


Add a comment
Comments
0 comments on the analysis NASDAQ100 - MINI NASDAQ100 FULL0624 - 15 min.