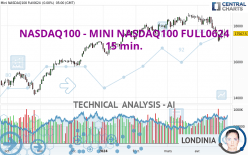
NASDAQ100 - MINI NASDAQ100 FULL0624 - 15 min. - Technical analysis published on 04/26/2024 (GMT)
- 59
- 0
Click here for a new analysis!
- Timeframe : 15 min.
- - Analysis generated on
- Status : LEVEL MAINTAINED
Summary of the analysis

Additional analysis
Quotes
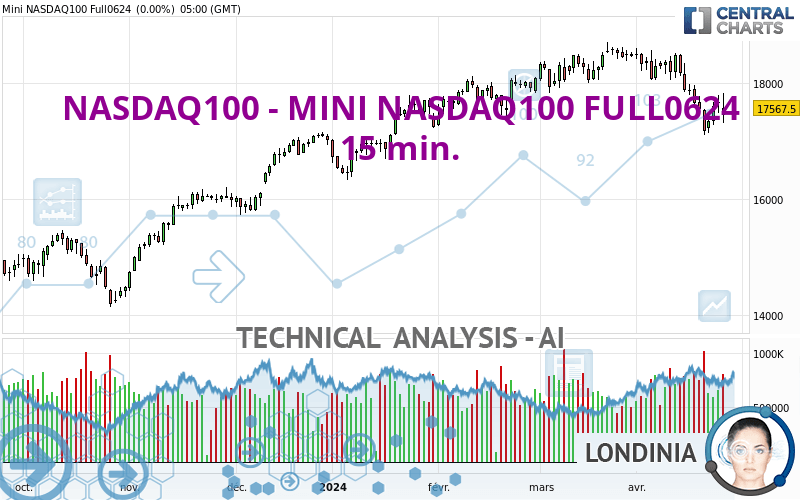
The NASDAQ100 - MINI NASDAQ100 FULL0624 price is 17,832.75 USD. On the day, this instrument gained +1.51% and was between 17,668.25 USD and 17,840.50 USD. This implies that the price is at +0.93% from its lowest and at -0.04% from its highest.A bullish opening was detected by the Central Gaps scanner. Buyers are trying to impose a bullish momentum in the very short term.
Bullish opening
Type : Bullish
Timeframe : Openning
A study of price movements over other periods shows the following variations:
Near a new HIGH record (5 years)
Type : Bullish
Timeframe : Weekly
Near a new HIGH record (1 year)
Type : Bullish
Timeframe : Weekly
Near a new HIGH record (1st january)
Type : Bullish
Timeframe : Weekly
Near a new HIGH record (1 month)
Type : Bullish
Timeframe : Weekly
Technical
Technical analysis of this 15 min. chart of NASDAQ100 - MINI NASDAQ100 FULL0624 indicates that the overall trend is strongly bullish. The signals given by the moving averages are 82.14% bullish. This strong bullish trend is confirmed by the strong signals currently being given by short-term moving averages. The Central Indicators market scanner is currently detecting several bullish signals that could impact this trend:
Bullish trend reversal : adaptative moving average 50
Type : Bullish
Timeframe : 15 minutes
Bullish price crossover with Moving Average 50
Type : Bullish
Timeframe : 15 minutes
Bullish price crossover with adaptative moving average 20
Type : Bullish
Timeframe : 15 minutes
In fact, according to the parameters integrated into the Central Analyzer system, 11 technical indicators out of 18 analysed are currently bullish. But beware of excesses. The Central Indicators scanner currently detects this:
CCI indicator is overbought : over 100
Type : Neutral
Timeframe : 15 minutes
Williams %R indicator is overbought : over -20
Type : Neutral
Timeframe : 15 minutes
MACD indicator is back over 0
Type : Bullish
Timeframe : 15 minutes
Price is back over the pivot point
Type : Bullish
Timeframe : Weekly
No signals are given by Central Patterns, a market scanner specialised in chart patterns, resistances and supports.
The Central Candlesticks scanner which studies Japanese candlesticks did not detect anything.
| S3 | S2 | S1 | Price | R1 | R2 | R3 | |
|---|---|---|---|---|---|---|---|
| ProTrendLines | 17,307.94 | 17,444.50 | 17,767.10 | 17,832.75 | 18,064.75 | 18,350.75 | 18,585.75 |
| Change (%) | -2.94% | -2.18% | -0.37% | - | +1.30% | +2.90% | +4.22% |
| Change | -524.81 | -388.25 | -65.65 | - | +232.00 | +518.00 | +753.00 |
| Level | Intermediate | Minor | Major | - | Intermediate | Minor | Intermediate |
Pivot points can also be used to set your price objectives. Here is the price situation in relation to pivot points:
| Pivot points | S3 | S2 | S1 | PP | R1 | R2 | R3 |
|---|---|---|---|---|---|---|---|
| Standard | 16,788.75 | 17,048.50 | 17,308.00 | 17,567.75 | 17,827.25 | 18,087.00 | 18,346.50 |
| Camarilla | 17,424.71 | 17,472.30 | 17,519.90 | 17,567.50 | 17,615.10 | 17,662.70 | 17,710.29 |
| Woodie | 16,788.63 | 17,048.44 | 17,307.88 | 17,567.69 | 17,827.13 | 18,086.94 | 18,346.38 |
| Fibonacci | 17,048.50 | 17,246.85 | 17,369.40 | 17,567.75 | 17,766.10 | 17,888.65 | 18,087.00 |
| Pivot points | S3 | S2 | S1 | PP | R1 | R2 | R3 |
|---|---|---|---|---|---|---|---|
| Standard | 15,508.25 | 16,310.75 | 16,745.75 | 17,548.25 | 17,983.25 | 18,785.75 | 19,220.75 |
| Camarilla | 16,840.44 | 16,953.88 | 17,067.31 | 17,180.75 | 17,294.19 | 17,407.63 | 17,521.06 |
| Woodie | 15,324.50 | 16,218.88 | 16,562.00 | 17,456.38 | 17,799.50 | 18,693.88 | 19,037.00 |
| Fibonacci | 16,310.75 | 16,783.48 | 17,075.53 | 17,548.25 | 18,020.98 | 18,313.03 | 18,785.75 |
| Pivot points | S3 | S2 | S1 | PP | R1 | R2 | R3 |
|---|---|---|---|---|---|---|---|
| Standard | 17,396.58 | 17,701.42 | 18,099.33 | 18,404.17 | 18,802.08 | 19,106.92 | 19,504.83 |
| Camarilla | 18,303.99 | 18,368.41 | 18,432.83 | 18,497.25 | 18,561.67 | 18,626.09 | 18,690.51 |
| Woodie | 17,443.13 | 17,724.69 | 18,145.88 | 18,427.44 | 18,848.63 | 19,130.19 | 19,551.38 |
| Fibonacci | 17,701.42 | 17,969.87 | 18,135.72 | 18,404.17 | 18,672.62 | 18,838.47 | 19,106.92 |
Numerical data
The following are the details of the technical indicators and moving averages that were collected to generate this technical analysis:
| RSI (14): | 57.52 | |
| MACD (12,26,9): | -3.3600 | |
| Directional Movement: | 8.66 | |
| AROON (14): | -28.57 | |
| DEMA (21): | 17,737.40 | |
| Parabolic SAR (0,02-0,02-0,2): | 17,801.89 | |
| Elder Ray (13): | 23.40 | |
| Super Trend (3,10): | 17,627.28 | |
| Zig ZAG (10): | 17,799.00 | |
| VORTEX (21): | 0.9800 | |
| Stochastique (14,3,5): | 67.17 | |
| TEMA (21): | 17,747.26 | |
| Williams %R (14): | -18.47 | |
| Chande Momentum Oscillator (20): | 34.25 | |
| Repulse (5,40,3): | 0.1800 | |
| ROCnROLL: | 1 | |
| TRIX (15,9): | 0.0000 | |
| Courbe Coppock: | 0.11 |
| MA7: | 17,535.04 | |
| MA20: | 17,961.88 | |
| MA50: | 18,165.22 | |
| MA100: | 17,776.33 | |
| MAexp7: | 17,752.23 | |
| MAexp20: | 17,739.12 | |
| MAexp50: | 17,731.81 | |
| MAexp100: | 17,692.33 | |
| Price / MA7: | +1.70% | |
| Price / MA20: | -0.72% | |
| Price / MA50: | -1.83% | |
| Price / MA100: | +0.32% | |
| Price / MAexp7: | +0.45% | |
| Price / MAexp20: | +0.53% | |
| Price / MAexp50: | +0.57% | |
| Price / MAexp100: | +0.79% |
About author

Online


Add a comment
Comments
0 comments on the analysis NASDAQ100 - MINI NASDAQ100 FULL0624 - 15 min.