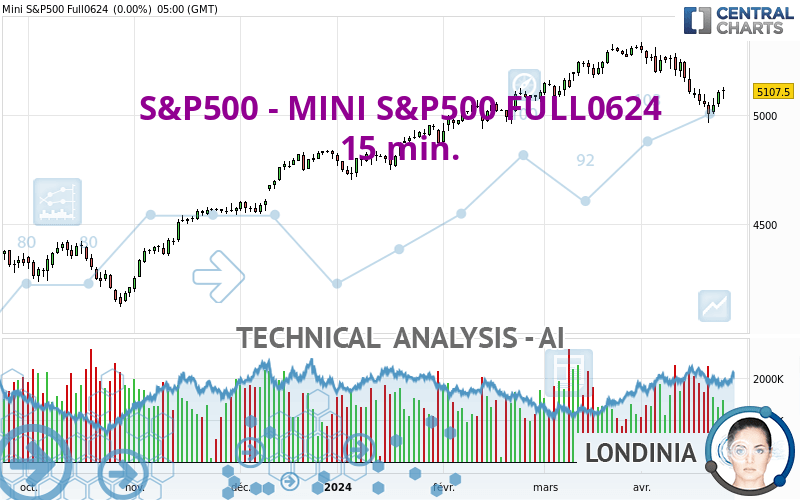
S&P500 - MINI S&P500 FULL0624 - 15 min. - Technical analysis published on 04/25/2024 (GMT)
- 61
- 0
Click here for a new analysis!
- Timeframe : 15 min.
- - Analysis generated on
- Status : TARGET REACHED

Summary of the analysis

Additional analysis
Quotes
The S&P500 - MINI S&P500 FULL0624 price is 5,083.25 USD. On the day, this instrument lost -0.48% with the lowest point at 5,022.25 USD and the highest point at 5,086.50 USD. The deviation from the price is +1.21% for the low point and -0.06% for the high point.A bearish gap was detected at the opening by the Central Gaps scanner. There are a lot of sellers and they have the upper hand in the very short term.
Opening Gap DOWN
Type : Bearish
Timeframe : Openning
So that you have an overall view of the price change, here is a table showing the variations over several periods:
Near a new HIGH record (5 years)
Type : Bullish
Timeframe : Weekly
Near a new HIGH record (1 year)
Type : Bullish
Timeframe : Weekly
Near a new HIGH record (1st january)
Type : Bullish
Timeframe : Weekly
Near a new HIGH record (1 month)
Type : Bullish
Timeframe : Weekly
Technical
Technical analysis of this 15 min. chart of S&P500 - MINI S&P500 FULL0624 indicates that the overall trend is slightly bullish. 60.71% of the signals given by moving averages are bullish. This slightly bullish trend could be reinforced by the strong bullish signals given by short-term moving averages. The Central Indicators market scanner is currently detecting several bullish signals that could impact this trend:
Bullish trend reversal : Moving Average 20
Type : Bullish
Timeframe : 15 minutes
Bullish trend reversal : Moving Average 50
Type : Bullish
Timeframe : 15 minutes
Bullish trend reversal : adaptative moving average 100
Type : Bullish
Timeframe : 15 minutes
In fact, 16 technical indicators on 18 studied are currently positioned bullish. But beware of excesses. The Central Indicators scanner currently detects this:
CCI indicator is overbought : over 100
Type : Neutral
Timeframe : 15 minutes
Williams %R indicator is overbought : over -20
Type : Neutral
Timeframe : 15 minutes
Price is back over the pivot point
Type : Bullish
Timeframe : Weekly
Central Patterns, the scanner specializing in chart patterns, did not identify any signals.
The Central Candlesticks scanner which studies Japanese candlesticks did not detect anything.
| S3 | S2 | S1 | Price | R1 | R2 | R3 | |
|---|---|---|---|---|---|---|---|
| ProTrendLines | 5,006.00 | 5,047.75 | 5,073.75 | 5,083.25 | 5,124.25 | 5,150.00 | 5,198.69 |
| Change (%) | -1.52% | -0.70% | -0.19% | - | +0.81% | +1.31% | +2.27% |
| Change | -77.25 | -35.50 | -9.50 | - | +41.00 | +66.75 | +115.44 |
| Level | Intermediate | Minor | Major | - | Major | Minor | Major |
Attention could also be paid to pivot points to set price objectives:
| Pivot points | S3 | S2 | S1 | PP | R1 | R2 | R3 |
|---|---|---|---|---|---|---|---|
| Standard | 5,020.42 | 5,046.33 | 5,076.92 | 5,102.83 | 5,133.42 | 5,159.33 | 5,189.92 |
| Camarilla | 5,091.96 | 5,097.14 | 5,102.32 | 5,107.50 | 5,112.68 | 5,117.86 | 5,123.04 |
| Woodie | 5,022.75 | 5,047.50 | 5,079.25 | 5,104.00 | 5,135.75 | 5,160.50 | 5,192.25 |
| Fibonacci | 5,046.33 | 5,067.92 | 5,081.25 | 5,102.83 | 5,124.42 | 5,137.75 | 5,159.33 |
| Pivot points | S3 | S2 | S1 | PP | R1 | R2 | R3 |
|---|---|---|---|---|---|---|---|
| Standard | 4,657.33 | 4,810.42 | 4,907.08 | 5,060.17 | 5,156.83 | 5,309.92 | 5,406.58 |
| Camarilla | 4,935.07 | 4,957.96 | 4,980.86 | 5,003.75 | 5,026.64 | 5,049.54 | 5,072.43 |
| Woodie | 4,629.13 | 4,796.31 | 4,878.88 | 5,046.06 | 5,128.63 | 5,295.81 | 5,378.38 |
| Fibonacci | 4,810.42 | 4,905.82 | 4,964.76 | 5,060.17 | 5,155.57 | 5,214.51 | 5,309.92 |
| Pivot points | S3 | S2 | S1 | PP | R1 | R2 | R3 |
|---|---|---|---|---|---|---|---|
| Standard | 4,964.25 | 5,045.75 | 5,170.50 | 5,252.00 | 5,376.75 | 5,458.25 | 5,583.00 |
| Camarilla | 5,238.53 | 5,257.44 | 5,276.34 | 5,295.25 | 5,314.16 | 5,333.06 | 5,351.97 |
| Woodie | 4,985.88 | 5,056.56 | 5,192.13 | 5,262.81 | 5,398.38 | 5,469.06 | 5,604.63 |
| Fibonacci | 5,045.75 | 5,124.54 | 5,173.21 | 5,252.00 | 5,330.79 | 5,379.46 | 5,458.25 |
Numerical data
The following is the status of the technical indicators and moving averages at the time of publication of this technical analysis:
| RSI (14): | 68.77 | |
| MACD (12,26,9): | 3.3400 | |
| Directional Movement: | 16.90 | |
| AROON (14): | 85.71 | |
| DEMA (21): | 5,061.47 | |
| Parabolic SAR (0,02-0,02-0,2): | 5,044.00 | |
| Elder Ray (13): | 19.01 | |
| Super Trend (3,10): | 5,050.34 | |
| Zig ZAG (10): | 5,082.50 | |
| VORTEX (21): | 1.1200 | |
| Stochastique (14,3,5): | 94.51 | |
| TEMA (21): | 5,073.61 | |
| Williams %R (14): | -6.90 | |
| Chande Momentum Oscillator (20): | 43.00 | |
| Repulse (5,40,3): | 0.2200 | |
| ROCnROLL: | 1 | |
| TRIX (15,9): | 0.0000 | |
| Courbe Coppock: | 1.28 |
| MA7: | 5,065.61 | |
| MA20: | 5,168.48 | |
| MA50: | 5,182.36 | |
| MA100: | 5,041.75 | |
| MAexp7: | 5,071.51 | |
| MAexp20: | 5,059.29 | |
| MAexp50: | 5,062.92 | |
| MAexp100: | 5,071.37 | |
| Price / MA7: | +0.35% | |
| Price / MA20: | -1.65% | |
| Price / MA50: | -1.91% | |
| Price / MA100: | +0.82% | |
| Price / MAexp7: | +0.23% | |
| Price / MAexp20: | +0.47% | |
| Price / MAexp50: | +0.40% | |
| Price / MAexp100: | +0.23% |
About author

Online


Add a comment
Comments
0 comments on the analysis S&P500 - MINI S&P500 FULL0624 - 15 min.