S&P500 - MINI S&P500 FULL0624 - 15 min. - Technical analysis published on 04/25/2024 (GMT)
- 68
- 0
- Timeframe : 15 min.
- - Analysis generated on
- Status : NEUTRAL

Summary of the analysis

Additional analysis
Quotes
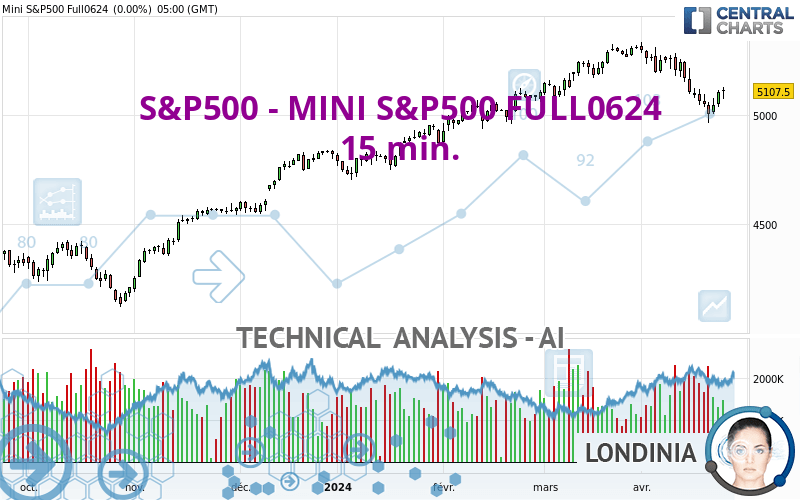
The S&P500 - MINI S&P500 FULL0624 rating is 5,082.00 USD. The price registered a decrease of -0.50% on the session with the lowest point at 5,022.25 USD and the highest point at 5,086.50 USD. The deviation from the price is +1.19% for the low point and -0.09% for the high point.The Central Gaps scanner detects the formation of a bearish gap marking the strong presence of sellers ahead of buyers at the opening. This formed a quotation gap.
Opening Gap DOWN
Type : Bearish
Timeframe : Openning
A study of price movements over other periods shows the following variations:
Near a new HIGH record (5 years)
Type : Bullish
Timeframe : Weekly
Near a new HIGH record (1 year)
Type : Bullish
Timeframe : Weekly
Near a new HIGH record (1st january)
Type : Bullish
Timeframe : Weekly
Near a new HIGH record (1 month)
Type : Bullish
Timeframe : Weekly
Technical
A technical analysis in 15 min. of this S&P500 - MINI S&P500 FULL0624 chart shows a slightly bearish trend. 53.57% of the signals given by moving averages are bearish. Caution: the slightly bullish signals currently given by short-term moving averages could cause a reversal of the trend. The Central Indicators scanner detects bullish and bearish signals on moving averages that could impact this trend:
Bullish trend reversal : Moving Average 20
Type : Bullish
Timeframe : 15 minutes
Bullish trend reversal : Moving Average 50
Type : Bullish
Timeframe : 15 minutes
Bullish trend reversal : adaptative moving average 100
Type : Bullish
Timeframe : 15 minutes
Bearish price crossover with Moving Average 50
Type : Bearish
Timeframe : 15 minutes
Bearish price crossover with adaptative moving average 100
Type : Bearish
Timeframe : 15 minutes
In fact, according to the parameters integrated into the Central Analyzer system, 12 technical indicators out of 18 analysed are currently bullish. But beware of excesses. The Central Indicators scanner currently detects this:
CCI indicator is overbought : over 100
Type : Neutral
Timeframe : 15 minutes
Williams %R indicator is overbought : over -20
Type : Neutral
Timeframe : 15 minutes
Pivot points : price is under support 1
Type : Neutral
Timeframe : 15 minutes
MACD indicator is back over 0
Type : Bullish
Timeframe : 15 minutes
Ichimoku - Bullish crossover : Tenkan & Kijun
Type : Bullish
Timeframe : 15 minutes
Price is back over the pivot point
Type : Bullish
Timeframe : Weekly
The analysis of the price chart with Central Patterns scanners does not return any result.
No result was found by the Central Candlesticks scanner on Japanese candlesticks.
| S3 | S2 | S1 | Price | R1 | R2 | R3 | |
|---|---|---|---|---|---|---|---|
| ProTrendLines | 5,006.00 | 5,047.75 | 5,073.75 | 5,082.00 | 5,124.25 | 5,150.00 | 5,198.69 |
| Change (%) | -1.50% | -0.67% | -0.16% | - | +0.83% | +1.34% | +2.30% |
| Change | -76.00 | -34.25 | -8.25 | - | +42.25 | +68.00 | +116.69 |
| Level | Intermediate | Minor | Major | - | Major | Minor | Major |
Attention could also be paid to pivot points to set price objectives:
| Pivot points | S3 | S2 | S1 | PP | R1 | R2 | R3 |
|---|---|---|---|---|---|---|---|
| Standard | 5,020.42 | 5,046.33 | 5,076.92 | 5,102.83 | 5,133.42 | 5,159.33 | 5,189.92 |
| Camarilla | 5,091.96 | 5,097.14 | 5,102.32 | 5,107.50 | 5,112.68 | 5,117.86 | 5,123.04 |
| Woodie | 5,022.75 | 5,047.50 | 5,079.25 | 5,104.00 | 5,135.75 | 5,160.50 | 5,192.25 |
| Fibonacci | 5,046.33 | 5,067.92 | 5,081.25 | 5,102.83 | 5,124.42 | 5,137.75 | 5,159.33 |
| Pivot points | S3 | S2 | S1 | PP | R1 | R2 | R3 |
|---|---|---|---|---|---|---|---|
| Standard | 4,657.33 | 4,810.42 | 4,907.08 | 5,060.17 | 5,156.83 | 5,309.92 | 5,406.58 |
| Camarilla | 4,935.07 | 4,957.96 | 4,980.86 | 5,003.75 | 5,026.64 | 5,049.54 | 5,072.43 |
| Woodie | 4,629.13 | 4,796.31 | 4,878.88 | 5,046.06 | 5,128.63 | 5,295.81 | 5,378.38 |
| Fibonacci | 4,810.42 | 4,905.82 | 4,964.76 | 5,060.17 | 5,155.57 | 5,214.51 | 5,309.92 |
| Pivot points | S3 | S2 | S1 | PP | R1 | R2 | R3 |
|---|---|---|---|---|---|---|---|
| Standard | 4,964.25 | 5,045.75 | 5,170.50 | 5,252.00 | 5,376.75 | 5,458.25 | 5,583.00 |
| Camarilla | 5,238.53 | 5,257.44 | 5,276.34 | 5,295.25 | 5,314.16 | 5,333.06 | 5,351.97 |
| Woodie | 4,985.88 | 5,056.56 | 5,192.13 | 5,262.81 | 5,398.38 | 5,469.06 | 5,604.63 |
| Fibonacci | 5,045.75 | 5,124.54 | 5,173.21 | 5,252.00 | 5,330.79 | 5,379.46 | 5,458.25 |
Numerical data
The following is the status of technical indicators and moving averages registered at the time this technical analysis was created:
| RSI (14): | 53.55 | |
| MACD (12,26,9): | -0.4600 | |
| Directional Movement: | 2.86 | |
| AROON (14): | 85.72 | |
| DEMA (21): | 5,051.59 | |
| Parabolic SAR (0,02-0,02-0,2): | 5,035.79 | |
| Elder Ray (13): | 6.53 | |
| Super Trend (3,10): | 5,037.68 | |
| Zig ZAG (10): | 5,061.50 | |
| VORTEX (21): | 0.9400 | |
| Stochastique (14,3,5): | 87.18 | |
| TEMA (21): | 5,057.64 | |
| Williams %R (14): | -15.70 | |
| Chande Momentum Oscillator (20): | 28.75 | |
| Repulse (5,40,3): | 0.1400 | |
| ROCnROLL: | 1 | |
| TRIX (15,9): | -0.0100 | |
| Courbe Coppock: | 0.86 |
| MA7: | 5,065.82 | |
| MA20: | 5,168.40 | |
| MA50: | 5,182.31 | |
| MA100: | 5,041.73 | |
| MAexp7: | 5,061.45 | |
| MAexp20: | 5,054.78 | |
| MAexp50: | 5,061.48 | |
| MAexp100: | 5,070.99 | |
| Price / MA7: | +0.32% | |
| Price / MA20: | -1.67% | |
| Price / MA50: | -1.94% | |
| Price / MA100: | +0.80% | |
| Price / MAexp7: | +0.41% | |
| Price / MAexp20: | +0.54% | |
| Price / MAexp50: | +0.41% | |
| Price / MAexp100: | +0.22% |
About author

Online


Add a comment
Comments
0 comments on the analysis S&P500 - MINI S&P500 FULL0624 - 15 min.