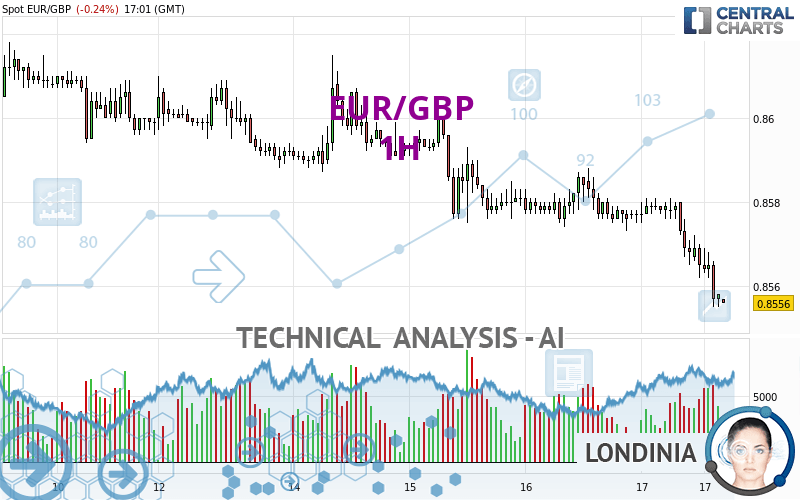
EUR/GBP - 1H - Technical analysis published on 05/17/2024 (GMT)
- 73
- 0
Click here for a new analysis!
- Timeframe : 1H
- - Analysis generated on
- Status : LEVEL MAINTAINED

Summary of the analysis

Additional analysis
Quotes
EUR/GBP rating 0.8556 GBP. The price registered a decrease of -0.25% on the session with the lowest point at 0.8555 GBP and the highest point at 0.8581 GBP. The deviation from the price is +0.01% for the low point and -0.29% for the high point.So that you have an overall view of the price change, here is a table showing the variations over several periods:
Near a new LOW record (5 years)
Type : Bearish
Timeframe : Weekly
Near a new HIGH record (1 year)
Type : Bullish
Timeframe : Weekly
Near a new HIGH record (1st january)
Type : Bullish
Timeframe : Weekly
Near a new HIGH record (1 month)
Type : Bullish
Timeframe : Weekly
Technical
Technical analysis of EUR/GBP in 1H shows a overall strongly bearish trend. 92.86% of the signals given by moving averages are bearish. This strongly bearish trend is supported by the strong bearish signals given by short-term moving averages. The Central Indicators scanner does not detect any result on moving averages that would impact this trend.
In fact, according to the parameters integrated into the Central Analyzer system, 13 technical indicators out of 18 analysed are currently bearish. Caution: the Central Indicators scanner currently detects an excess:
RSI indicator is oversold : under 30
Type : Neutral
Timeframe : 1 hour
CCI indicator is oversold : under -100
Type : Neutral
Timeframe : 1 hour
Previous candle closed under Bollinger bands
Type : Neutral
Timeframe : 1 hour
CCI indicator: bullish divergence
Type : Bullish
Timeframe : 1 hour
Williams %R indicator is oversold : under -80
Type : Neutral
Timeframe : 1 hour
Pivot points : price is under support 1
Type : Neutral
Timeframe : Weekly
Pivot points : price is under support 3
Type : Neutral
Timeframe : 1 hour
An analysis of the price chart with the Central Patterns scanner (detector of chart patterns and resistances and supports) shows several results that can have an impact on the price change:
Near horizontal support
Type : Bullish
Timeframe : 1 hour
Support of channel is broken
Type : Bearish
Timeframe : 1 hour
There is also a Japanese candlestick pattern detected by Central Candlesticks that could mark the end of the current short-term trend:
Doji
Type : Neutral
Timeframe : 1 hour
| S3 | S2 | S1 | Price | R1 | R2 | R3 | |
|---|---|---|---|---|---|---|---|
| ProTrendLines | 0.8300 | 0.8511 | 0.8531 | 0.8556 | 0.8562 | 0.8574 | 0.8588 |
| Change (%) | -2.99% | -0.53% | -0.29% | - | +0.07% | +0.21% | +0.37% |
| Change | -0.0256 | -0.0045 | -0.0025 | - | +0.0006 | +0.0018 | +0.0032 |
| Level | Major | Major | Intermediate | - | Intermediate | Major | Intermediate |
Attention could also be paid to pivot points to set price objectives:
| Pivot points | S3 | S2 | S1 | PP | R1 | R2 | R3 |
|---|---|---|---|---|---|---|---|
| Standard | 0.8556 | 0.8564 | 0.8571 | 0.8579 | 0.8586 | 0.8594 | 0.8601 |
| Camarilla | 0.8573 | 0.8574 | 0.8576 | 0.8577 | 0.8578 | 0.8580 | 0.8581 |
| Woodie | 0.8555 | 0.8564 | 0.8570 | 0.8579 | 0.8585 | 0.8594 | 0.8600 |
| Fibonacci | 0.8564 | 0.8570 | 0.8574 | 0.8579 | 0.8585 | 0.8589 | 0.8594 |
| Pivot points | S3 | S2 | S1 | PP | R1 | R2 | R3 |
|---|---|---|---|---|---|---|---|
| Standard | 0.8498 | 0.8527 | 0.8563 | 0.8592 | 0.8628 | 0.8657 | 0.8693 |
| Camarilla | 0.8581 | 0.8587 | 0.8593 | 0.8599 | 0.8605 | 0.8611 | 0.8617 |
| Woodie | 0.8502 | 0.8529 | 0.8567 | 0.8594 | 0.8632 | 0.8659 | 0.8697 |
| Fibonacci | 0.8527 | 0.8552 | 0.8567 | 0.8592 | 0.8617 | 0.8632 | 0.8657 |
| Pivot points | S3 | S2 | S1 | PP | R1 | R2 | R3 |
|---|---|---|---|---|---|---|---|
| Standard | 0.8368 | 0.8445 | 0.8492 | 0.8569 | 0.8616 | 0.8693 | 0.8740 |
| Camarilla | 0.8506 | 0.8517 | 0.8529 | 0.8540 | 0.8551 | 0.8563 | 0.8574 |
| Woodie | 0.8354 | 0.8438 | 0.8478 | 0.8562 | 0.8602 | 0.8686 | 0.8726 |
| Fibonacci | 0.8445 | 0.8492 | 0.8521 | 0.8569 | 0.8616 | 0.8645 | 0.8693 |
Numerical data
The following are the details of the technical indicators and moving averages that were collected to generate this technical analysis:
| RSI (14): | 21.32 | |
| MACD (12,26,9): | -0.0005 | |
| Directional Movement: | -20.1639 | |
| AROON (14): | -85.7142 | |
| DEMA (21): | 0.8564 | |
| Parabolic SAR (0,02-0,02-0,2): | 0.8570 | |
| Elder Ray (13): | -0.0011 | |
| Super Trend (3,10): | 0.8574 | |
| Zig ZAG (10): | 0.8557 | |
| VORTEX (21): | 0.8019 | |
| Stochastique (14,3,5): | 10.39 | |
| TEMA (21): | 0.8561 | |
| Williams %R (14): | -92.31 | |
| Chande Momentum Oscillator (20): | -0.0021 | |
| Repulse (5,40,3): | -0.0934 | |
| ROCnROLL: | 2 | |
| TRIX (15,9): | -0.0054 | |
| Courbe Coppock: | 0.34 |
| MA7: | 0.8587 | |
| MA20: | 0.8579 | |
| MA50: | 0.8567 | |
| MA100: | 0.8565 | |
| MAexp7: | 0.8563 | |
| MAexp20: | 0.8570 | |
| MAexp50: | 0.8577 | |
| MAexp100: | 0.8582 | |
| Price / MA7: | -0.36% | |
| Price / MA20: | -0.27% | |
| Price / MA50: | -0.13% | |
| Price / MA100: | -0.11% | |
| Price / MAexp7: | -0.08% | |
| Price / MAexp20: | -0.16% | |
| Price / MAexp50: | -0.24% | |
| Price / MAexp100: | -0.30% |
News
The latest news and videos published on EUR/GBP at the time of the analysis were as follows:
-
 EUR/GBP Forecast May 17, 2024
-
EUR/GBP Forecast May 1, 2024
-
EUR/GBP Forecast April 25, 2024
-
Weekly Technical Outlook: 08/04/2024 - USDJPY, EURGBP, USDCAD
-
EUR/GBP Forecast April 2, 2024
About author

Online


Add a comment
Comments
0 comments on the analysis EUR/GBP - 1H