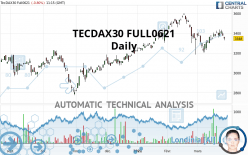
TECDAX30 FULL0624 - Daily - Technical analysis published on 03/25/2021 (GMT)
- 215
- 0
Click here for a new analysis!
- Timeframe : Daily
- - Analysis generated on
- Status : TARGET REACHED

Summary of the analysis

Additional analysis
Quotes
The TECDAX30 FULL0621 rating is 3,348.00 EUR. The price is lower by -0.80% since the last closing and was between 3,327.50 EUR and 3,364.00 EUR. This implies that the price is at +0.62% from its lowest and at -0.48% from its highest.The Central Gaps scanner detects a bearish gap which is a sign that the sellers have taken the lead in the very short term.
Opening Gap DOWN
Type : Bearish
Timeframe : Openning
A study of price movements over other periods shows the following variations:
Near a new HIGH record (5 years)
Type : Bullish
Timeframe : Weekly
Near a new HIGH record (1 month)
Type : Bullish
Timeframe : Weekly
Technical
A technical analysis in Daily of this TECDAX30 FULL0621 chart shows a bullish trend. 71.43% of the signals given by moving averages are bullish. Caution: the neutral signals currently given by short-term moving averages show us that the global trend is losing momentum. The Central Indicators market scanner is currently detecting a bearish signal that could impact this trend:
Bearish price crossover with adaptative moving average 50
Type : Bearish
Timeframe : Daily
In fact, according to the parameters integrated into the Central Analyzer system, only 9 technical indicators out of 18 analysed are currently bullish. Caution: the Central Indicators scanner currently detects an excess:
CCI indicator: bullish divergence
Type : Bullish
Timeframe : Daily
Pivot points : price is over resistance 1
Type : Neutral
Timeframe : Weekly
Pivot points : price is over resistance 3
Type : Neutral
Timeframe : Daily
Pivot points : price is under support 3
Type : Neutral
Timeframe : Daily
Ichimoku - Bullish crossover : Tenkan & Kijun
Type : Bullish
Timeframe : Daily
Price is back under the pivot point
Type : Bearish
Timeframe : Weekly
Central Patterns, the scanner specializing in chart patterns, did not identify any signals.
No result was found by the Central Candlesticks scanner on Japanese candlesticks.
| S3 | S2 | S1 | Price | R1 | R2 | R3 | |
|---|---|---|---|---|---|---|---|
| ProTrendLines | 2,979.83 | 3,039.00 | 3,277.90 | 3,348.00 | 3,378.50 | 3,493.50 | 3,588.00 |
| Change (%) | -11.00% | -9.23% | -2.09% | - | +0.91% | +4.35% | +7.17% |
| Change | -368.17 | -309.00 | -70.10 | - | +30.50 | +145.50 | +240.00 |
| Level | Intermediate | Minor | Major | - | Minor | Minor | Major |
Pivot points can also be used to set your price objectives. Here is the price situation in relation to pivot points:
| Pivot points | S3 | S2 | S1 | PP | R1 | R2 | R3 |
|---|---|---|---|---|---|---|---|
| Standard | 3,320.33 | 3,347.67 | 3,361.33 | 3,388.67 | 3,402.33 | 3,429.67 | 3,443.33 |
| Camarilla | 3,363.73 | 3,367.48 | 3,371.24 | 3,375.00 | 3,378.76 | 3,382.52 | 3,386.28 |
| Woodie | 3,313.50 | 3,344.25 | 3,354.50 | 3,385.25 | 3,395.50 | 3,426.25 | 3,436.50 |
| Fibonacci | 3,347.67 | 3,363.33 | 3,373.01 | 3,388.67 | 3,404.33 | 3,414.01 | 3,429.67 |
| Pivot points | S3 | S2 | S1 | PP | R1 | R2 | R3 |
|---|---|---|---|---|---|---|---|
| Standard | 3,230.00 | 3,268.50 | 3,325.00 | 3,363.50 | 3,420.00 | 3,458.50 | 3,515.00 |
| Camarilla | 3,355.38 | 3,364.08 | 3,372.79 | 3,381.50 | 3,390.21 | 3,398.92 | 3,407.63 |
| Woodie | 3,239.00 | 3,273.00 | 3,334.00 | 3,368.00 | 3,429.00 | 3,463.00 | 3,524.00 |
| Fibonacci | 3,268.50 | 3,304.79 | 3,327.21 | 3,363.50 | 3,399.79 | 3,422.21 | 3,458.50 |
| Pivot points | S3 | S2 | S1 | PP | R1 | R2 | R3 |
|---|---|---|---|---|---|---|---|
| Standard | 2,702.33 | 2,928.17 | 3,121.33 | 3,347.17 | 3,540.33 | 3,766.17 | 3,959.33 |
| Camarilla | 3,199.28 | 3,237.68 | 3,276.09 | 3,314.50 | 3,352.91 | 3,391.32 | 3,429.73 |
| Woodie | 2,686.00 | 2,920.00 | 3,105.00 | 3,339.00 | 3,524.00 | 3,758.00 | 3,943.00 |
| Fibonacci | 2,928.17 | 3,088.23 | 3,187.11 | 3,347.17 | 3,507.23 | 3,606.11 | 3,766.17 |
Numerical data
The following is the status of the technical indicators and moving averages at the time of publication of this technical analysis:
| RSI (14): | 49.29 | |
| MACD (12,26,9): | 5.2000 | |
| Directional Movement: | -7.31 | |
| AROON (14): | 71.43 | |
| DEMA (21): | 3,357.22 | |
| Parabolic SAR (0,02-0,02-0,2): | 3,297.47 | |
| Elder Ray (13): | -11.75 | |
| Super Trend (3,10): | 3,245.66 | |
| Zig ZAG (10): | 3,348.00 | |
| VORTEX (21): | 0.9600 | |
| Stochastique (14,3,5): | 77.74 | |
| TEMA (21): | 3,356.16 | |
| Williams %R (14): | -34.54 | |
| Chande Momentum Oscillator (20): | 68.50 | |
| Repulse (5,40,3): | -0.7900 | |
| ROCnROLL: | -1 | |
| TRIX (15,9): | -0.0400 | |
| Courbe Coppock: | 5.78 |
| MA7: | 3,377.36 | |
| MA20: | 3,324.43 | |
| MA50: | 3,372.97 | |
| MA100: | 3,224.11 | |
| MAexp7: | 3,367.92 | |
| MAexp20: | 3,354.57 | |
| MAexp50: | 3,330.73 | |
| MAexp100: | 3,256.05 | |
| Price / MA7: | -0.87% | |
| Price / MA20: | +0.71% | |
| Price / MA50: | -0.74% | |
| Price / MA100: | +3.84% | |
| Price / MAexp7: | -0.59% | |
| Price / MAexp20: | -0.20% | |
| Price / MAexp50: | +0.52% | |
| Price / MAexp100: | +2.82% |
About author

Online


Add a comment
Comments
0 comments on the analysis TECDAX30 FULL0624 - Daily