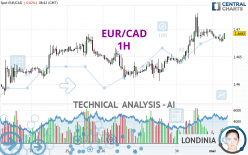
EUR/CAD - 1H - Technical analysis published on 05/01/2024 (GMT)
- 74
- 0
Click here for a new analysis!
- Timeframe : 1H
- - Analysis generated on
- Status : LEVEL MAINTAINED

Summary of the analysis

Additional analysis
Quotes
The EUR/CAD rating is 1.4692 CAD. On the day, this instrument lost -0.02% and was between 1.4676 CAD and 1.4696 CAD. This implies that the price is at +0.11% from its lowest and at -0.03% from its highest.A study of price movements over other periods shows the following variations:
Near a new LOW record (1 year)
Type : Bearish
Timeframe : Weekly
Near a new LOW record (1st january)
Type : Bearish
Timeframe : Weekly
Near a new HIGH record (1 month)
Type : Bullish
Timeframe : Weekly
Technical
Technical analysis of EUR/CAD in 1H shows a strongly overall bullish trend. 89.29% of the signals given by moving averages are bullish. The slightly bullish signals given by the short-term moving averages show a weakening of the global trend. An assessment of moving averages reveals several bullish signals that could impact this trend:
Bullish price crossover with Moving Average 20
Type : Bullish
Timeframe : 1 hour
Bullish price crossover with adaptative moving average 20
Type : Bullish
Timeframe : 1 hour
The probability of a further increase are moderate given the direction of the technical indicators.
Central Indicators, the detector scanner for these technical indicators has recently detected several signals:
Pivot points : price is over resistance 1
Type : Neutral
Timeframe : Weekly
Price is back over the pivot point
Type : Bullish
Timeframe : 1 hour
Williams %R indicator is back over -50
Type : Bullish
Timeframe : 1 hour
The Central Patterns scanner, which studies chart patterns, resistances and supports, has identified these signals:
Near horizontal support
Type : Bullish
Timeframe : 1 hour
Support of channel is broken
Type : Bearish
Timeframe : 1 hour
The Central Candlesticks scanner, specialised in Japanese candlesticks, did not identify any signals.
| S3 | S2 | S1 | Price | R1 | R2 | R3 | |
|---|---|---|---|---|---|---|---|
| ProTrendLines | 1.4624 | 1.4636 | 1.4691 | 1.4692 | 1.4729 | 1.4758 | 1.4908 |
| Change (%) | -0.46% | -0.38% | -0.01% | - | +0.25% | +0.45% | +1.47% |
| Change | -0.0068 | -0.0056 | -0.0001 | - | +0.0037 | +0.0066 | +0.0216 |
| Level | Major | Intermediate | Minor | - | Intermediate | Major | Minor |
To determine price objectives, it is also possible to use the pivot points. Here is the price position in relation to pivot points:
| Pivot points | S3 | S2 | S1 | PP | R1 | R2 | R3 |
|---|---|---|---|---|---|---|---|
| Standard | 1.4551 | 1.4594 | 1.4644 | 1.4687 | 1.4737 | 1.4780 | 1.4830 |
| Camarilla | 1.4669 | 1.4678 | 1.4687 | 1.4695 | 1.4704 | 1.4712 | 1.4721 |
| Woodie | 1.4556 | 1.4596 | 1.4649 | 1.4689 | 1.4742 | 1.4782 | 1.4835 |
| Fibonacci | 1.4594 | 1.4629 | 1.4651 | 1.4687 | 1.4722 | 1.4744 | 1.4780 |
| Pivot points | S3 | S2 | S1 | PP | R1 | R2 | R3 |
|---|---|---|---|---|---|---|---|
| Standard | 1.4458 | 1.4519 | 1.4569 | 1.4630 | 1.4680 | 1.4741 | 1.4791 |
| Camarilla | 1.4589 | 1.4599 | 1.4609 | 1.4619 | 1.4629 | 1.4639 | 1.4650 |
| Woodie | 1.4453 | 1.4516 | 1.4564 | 1.4627 | 1.4675 | 1.4738 | 1.4786 |
| Fibonacci | 1.4519 | 1.4561 | 1.4588 | 1.4630 | 1.4672 | 1.4699 | 1.4741 |
| Pivot points | S3 | S2 | S1 | PP | R1 | R2 | R3 |
|---|---|---|---|---|---|---|---|
| Standard | 1.4355 | 1.4450 | 1.4573 | 1.4668 | 1.4791 | 1.4886 | 1.5009 |
| Camarilla | 1.4635 | 1.4655 | 1.4675 | 1.4695 | 1.4715 | 1.4735 | 1.4755 |
| Woodie | 1.4368 | 1.4457 | 1.4586 | 1.4675 | 1.4804 | 1.4893 | 1.5022 |
| Fibonacci | 1.4450 | 1.4534 | 1.4585 | 1.4668 | 1.4752 | 1.4803 | 1.4886 |
Numerical data
The following is the status of the technical indicators and moving averages at the time of publication of this technical analysis:
| RSI (14): | 57.76 | |
| MACD (12,26,9): | 0.0005 | |
| Directional Movement: | 3.3960 | |
| AROON (14): | -71.4286 | |
| DEMA (21): | 1.4692 | |
| Parabolic SAR (0,02-0,02-0,2): | 1.4715 | |
| Elder Ray (13): | 0.0001 | |
| Super Trend (3,10): | 1.4656 | |
| Zig ZAG (10): | 1.4692 | |
| VORTEX (21): | 1.0205 | |
| Stochastique (14,3,5): | 32.00 | |
| TEMA (21): | 1.4688 | |
| Williams %R (14): | -32.00 | |
| Chande Momentum Oscillator (20): | -0.0002 | |
| Repulse (5,40,3): | 0.0698 | |
| ROCnROLL: | 1 | |
| TRIX (15,9): | 0.0078 | |
| Courbe Coppock: | 0.11 |
| MA7: | 1.4655 | |
| MA20: | 1.4672 | |
| MA50: | 1.4684 | |
| MA100: | 1.4645 | |
| MAexp7: | 1.4686 | |
| MAexp20: | 1.4684 | |
| MAexp50: | 1.4670 | |
| MAexp100: | 1.4660 | |
| Price / MA7: | +0.25% | |
| Price / MA20: | +0.14% | |
| Price / MA50: | +0.05% | |
| Price / MA100: | +0.32% | |
| Price / MAexp7: | +0.04% | |
| Price / MAexp20: | +0.05% | |
| Price / MAexp50: | +0.15% | |
| Price / MAexp100: | +0.22% |
News
The last news published on EUR/CAD at the time of the generation of this analysis was as follows:
-
 Forex Analysis: EUR/USD, GBP/USD, EUR/CAD - Amana Capital
-
Why I'm looking to sell EURCAD: Coleman
-
EUR/CAD To Hold Steady
-
EUR/CAD Bullish Breakthrough
-
Bullish Divergence – EURCAD
About author

Online


Add a comment
Comments
0 comments on the analysis EUR/CAD - 1H