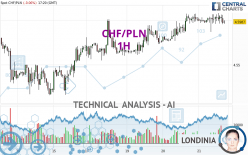
CHF/PLN - 1H - Technical analysis published on 12/21/2023 (GMT)
- 108
- 0
Click here for a new analysis!
- Timeframe : 1H
- - Analysis generated on
- Status : TARGET REACHED

Summary of the analysis

Additional analysis
Quotes
The CHF/PLN price is 4.5987 PLN. The price is lower by -0.06% since the last closing and was between 4.5870 PLN and 4.6085 PLN. This implies that the price is at +0.26% from its lowest and at -0.21% from its highest.The Central Gaps scanner detects a bullish opening marking the presence of buyers ahead of sellers at the opening but not sufficiently marked to allow the price to register a quotation gap.
Bullish opening
Type : Bullish
Timeframe : Openning
Here is a more detailed summary of the historical variations registered by CHF/PLN:
Near a new LOW record (1 year)
Type : Bearish
Timeframe : Weekly
Near a new LOW record (1st january)
Type : Bearish
Timeframe : Weekly
New HIGH record (1 month)
Type : Bullish
Timeframe : Weekly
Technical
Technical analysis of CHF/PLN in 1H shows an overall bullish trend. 71.43% of the signals given by moving averages are bullish. Caution: the neutral signals currently given by short-term moving averages show us that the global trend is losing momentum. The Central Indicators scanner detects bearish signals on moving averages that could impact this trend:
Bearish trend reversal : Moving Average 20
Type : Bearish
Timeframe : 1 hour
Bearish trend reversal : adaptative moving average 20
Type : Bearish
Timeframe : 1 hour
Bearish price crossover with adaptative moving average 20
Type : Bearish
Timeframe : 1 hour
An assessment of technical indicators does not currently provide any relevant information on the direction of future price movements.
But beware of excesses. The Central Indicators scanner currently detects this:
CCI indicator is oversold : under -100
Type : Neutral
Timeframe : 1 hour
The Central Patterns scanner, which studies chart patterns, resistances and supports, has identified these signals:
Near support of channel
Type : Bullish
Timeframe : 1 hour
Near support of triangle
Type : Bullish
Timeframe : 1 hour
Central Candlesticks, the scanner specialised in Japanese candlesticks, detects these signals that could have an impact on the current short-term trend:
Bullish harami
Type : Bullish
Timeframe : 1 hour
Bullish harami cross
Type : Bullish
Timeframe : 1 hour
Doji
Type : Neutral
Timeframe : 1 hour
| S3 | S2 | S1 | Price | R1 | R2 | R3 | |
|---|---|---|---|---|---|---|---|
| ProTrendLines | 4.5610 | 4.5764 | 4.5960 | 4.5987 | 4.6079 | 4.6624 | 4.7468 |
| Change (%) | -0.82% | -0.48% | -0.06% | - | +0.20% | +1.39% | +3.22% |
| Change | -0.0377 | -0.0223 | -0.0027 | - | +0.0092 | +0.0637 | +0.1481 |
| Level | Minor | Intermediate | Major | - | Minor | Intermediate | Minor |
Attention could also be paid to pivot points to set price objectives:
| Pivot points | S3 | S2 | S1 | PP | R1 | R2 | R3 |
|---|---|---|---|---|---|---|---|
| Standard | 4.5505 | 4.5632 | 4.5824 | 4.5951 | 4.6143 | 4.6270 | 4.6462 |
| Camarilla | 4.5927 | 4.5957 | 4.5986 | 4.6015 | 4.6044 | 4.6074 | 4.6103 |
| Woodie | 4.5537 | 4.5648 | 4.5856 | 4.5967 | 4.6175 | 4.6286 | 4.6494 |
| Fibonacci | 4.5632 | 4.5754 | 4.5830 | 4.5951 | 4.6073 | 4.6149 | 4.6270 |
| Pivot points | S3 | S2 | S1 | PP | R1 | R2 | R3 |
|---|---|---|---|---|---|---|---|
| Standard | 4.4389 | 4.4771 | 4.5235 | 4.5617 | 4.6081 | 4.6463 | 4.6927 |
| Camarilla | 4.5465 | 4.5543 | 4.5621 | 4.5698 | 4.5776 | 4.5853 | 4.5931 |
| Woodie | 4.4429 | 4.4792 | 4.5275 | 4.5638 | 4.6121 | 4.6484 | 4.6967 |
| Fibonacci | 4.4771 | 4.5095 | 4.5294 | 4.5617 | 4.5941 | 4.6140 | 4.6463 |
| Pivot points | S3 | S2 | S1 | PP | R1 | R2 | R3 |
|---|---|---|---|---|---|---|---|
| Standard | 4.2621 | 4.3677 | 4.4678 | 4.5734 | 4.6735 | 4.7791 | 4.8792 |
| Camarilla | 4.5113 | 4.5302 | 4.5490 | 4.5679 | 4.5868 | 4.6056 | 4.6245 |
| Woodie | 4.2594 | 4.3663 | 4.4651 | 4.5720 | 4.6708 | 4.7777 | 4.8765 |
| Fibonacci | 4.3677 | 4.4463 | 4.4948 | 4.5734 | 4.6520 | 4.7005 | 4.7791 |
Numerical data
The following is the status of the technical indicators and moving averages at the time of publication of this technical analysis:
| RSI (14): | 45.87 | |
| MACD (12,26,9): | 0.0018 | |
| Directional Movement: | -1.4495 | |
| AROON (14): | 35.7143 | |
| DEMA (21): | 4.6034 | |
| Parabolic SAR (0,02-0,02-0,2): | 4.5912 | |
| Elder Ray (13): | -0.0036 | |
| Super Trend (3,10): | 4.5839 | |
| Zig ZAG (10): | 4.5977 | |
| VORTEX (21): | 0.9919 | |
| Stochastique (14,3,5): | 58.45 | |
| TEMA (21): | 4.6013 | |
| Williams %R (14): | -48.84 | |
| Chande Momentum Oscillator (20): | -0.0023 | |
| Repulse (5,40,3): | -0.0656 | |
| ROCnROLL: | -1 | |
| TRIX (15,9): | 0.0096 | |
| Courbe Coppock: | 0.02 |
| MA7: | 4.5670 | |
| MA20: | 4.5610 | |
| MA50: | 4.6016 | |
| MA100: | 4.6685 | |
| MAexp7: | 4.6008 | |
| MAexp20: | 4.6001 | |
| MAexp50: | 4.5933 | |
| MAexp100: | 4.5843 | |
| Price / MA7: | +0.69% | |
| Price / MA20: | +0.83% | |
| Price / MA50: | -0.06% | |
| Price / MA100: | -1.50% | |
| Price / MAexp7: | -0.05% | |
| Price / MAexp20: | -0.03% | |
| Price / MAexp50: | +0.12% | |
| Price / MAexp100: | +0.31% |
About author
Online


Add a comment
Comments
0 comments on the analysis CHF/PLN - 1H