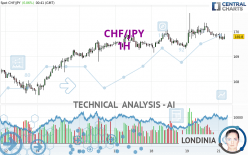
CHF/JPY - 1H - Technical analysis published on 04/22/2024 (GMT)
- 116
- 0
Click here for a new analysis!
- Timeframe : 1H
- - Analysis generated on
- Status : LEVEL MAINTAINED

Summary of the analysis

Additional analysis
Quotes
The CHF/JPY price is 169.80 JPY. The price registered an increase of +0.07% on the session and was traded between 169.68 JPY and 169.91 JPY over the period. The price is currently at +0.07% from its lowest and -0.06% from its highest.The Central Gaps scanner detects a bullish opening. A small advantage for buyers in the very short term.
Bullish opening
Type : Bullish
Timeframe : Openning
A study of price movements over other periods shows the following variations:
Near a new HIGH record (5 years)
Type : Bullish
Timeframe : Weekly
Near a new HIGH record (1 year)
Type : Bullish
Timeframe : Weekly
Near a new LOW record (1st january)
Type : Bearish
Timeframe : Weekly
Near a new LOW record (1 month)
Type : Bearish
Timeframe : Weekly
Technical
Technical analysis of this 1H chart of CHF/JPY indicates that the overall trend is bullish. The signals given by moving averages are 71.43% bullish. This bullish trend could slow down given the neutral signals currently being given by short-term moving averages. An assessment of moving averages reveals several bullish signals that could impact this trend:
Bullish price crossover with Moving Average 50
Type : Bullish
Timeframe : 1 hour
Bullish price crossover with adaptative moving average 20
Type : Bullish
Timeframe : 1 hour
Bullish price crossover with adaptative moving average 100
Type : Bullish
Timeframe : 1 hour
In fact, of the 18 technical indicators analysed by Central Analyzer, 5 are bullish, 7 are neutral and 6 are bearish. But beware of excesses. The Central Indicators scanner currently detects this:
RSI indicator: bullish divergence
Type : Bullish
Timeframe : 1 hour
Price is back over the pivot point
Type : Bullish
Timeframe : 1 hour
Central Patterns, the market scanner focusing on chart patterns, resistances and supports found these results:
Near horizontal support
Type : Bullish
Timeframe : 1 hour
Near support of triangle
Type : Bullish
Timeframe : 1 hour
Support of channel is broken
Type : Bearish
Timeframe : 1 hour
The Central Candlesticks scanner, specialised in Japanese candlesticks, did not identify any signals.
| S3 | S2 | S1 | Price | R1 | R2 | R3 | |
|---|---|---|---|---|---|---|---|
| ProTrendLines | 167.45 | 168.50 | 169.41 | 169.80 | 170.07 | 170.42 | 170.74 |
| Change (%) | -1.38% | -0.77% | -0.23% | - | +0.16% | +0.37% | +0.55% |
| Change | -2.35 | -1.30 | -0.39 | - | +0.27 | +0.62 | +0.94 |
| Level | Intermediate | Intermediate | Major | - | Minor | Intermediate | Minor |
Attention could also be paid to pivot points to set price objectives:
| Pivot points | S3 | S2 | S1 | PP | R1 | R2 | R3 |
|---|---|---|---|---|---|---|---|
| Standard | 169.32 | 169.50 | 169.59 | 169.77 | 169.86 | 170.04 | 170.13 |
| Camarilla | 169.62 | 169.64 | 169.67 | 169.69 | 169.72 | 169.74 | 169.76 |
| Woodie | 169.29 | 169.48 | 169.56 | 169.75 | 169.83 | 170.02 | 170.10 |
| Fibonacci | 169.50 | 169.60 | 169.66 | 169.77 | 169.87 | 169.93 | 170.04 |
| Pivot points | S3 | S2 | S1 | PP | R1 | R2 | R3 |
|---|---|---|---|---|---|---|---|
| Standard | 164.68 | 166.06 | 167.97 | 169.35 | 171.26 | 172.64 | 174.55 |
| Camarilla | 168.97 | 169.27 | 169.57 | 169.87 | 170.17 | 170.47 | 170.78 |
| Woodie | 164.94 | 166.19 | 168.23 | 169.48 | 171.52 | 172.77 | 174.81 |
| Fibonacci | 166.06 | 167.32 | 168.10 | 169.35 | 170.61 | 171.39 | 172.64 |
| Pivot points | S3 | S2 | S1 | PP | R1 | R2 | R3 |
|---|---|---|---|---|---|---|---|
| Standard | 161.74 | 164.16 | 165.99 | 168.41 | 170.24 | 172.66 | 174.49 |
| Camarilla | 166.66 | 167.05 | 167.44 | 167.83 | 168.22 | 168.61 | 169.00 |
| Woodie | 161.46 | 164.01 | 165.71 | 168.26 | 169.96 | 172.51 | 174.21 |
| Fibonacci | 164.16 | 165.78 | 166.78 | 168.41 | 170.03 | 171.03 | 172.66 |
Numerical data
The following is the status of the technical indicators and moving averages at the time of publication of this technical analysis:
| RSI (14): | 50.12 | |
| MACD (12,26,9): | 0.0000 | |
| Directional Movement: | 1.82 | |
| AROON (14): | -85.72 | |
| DEMA (21): | 169.88 | |
| Parabolic SAR (0,02-0,02-0,2): | 170.25 | |
| Elder Ray (13): | -0.06 | |
| Super Trend (3,10): | 169.44 | |
| Zig ZAG (10): | 169.85 | |
| VORTEX (21): | 0.9700 | |
| Stochastique (14,3,5): | 12.82 | |
| TEMA (21): | 169.81 | |
| Williams %R (14): | -75.00 | |
| Chande Momentum Oscillator (20): | -0.32 | |
| Repulse (5,40,3): | 0.0200 | |
| ROCnROLL: | 1 | |
| TRIX (15,9): | 0.0000 | |
| Courbe Coppock: | 0.30 |
| MA7: | 169.56 | |
| MA20: | 168.37 | |
| MA50: | 169.03 | |
| MA100: | 168.92 | |
| MAexp7: | 169.81 | |
| MAexp20: | 169.86 | |
| MAexp50: | 169.76 | |
| MAexp100: | 169.50 | |
| Price / MA7: | +0.14% | |
| Price / MA20: | +0.85% | |
| Price / MA50: | +0.46% | |
| Price / MA100: | +0.52% | |
| Price / MAexp7: | -0.01% | |
| Price / MAexp20: | -0.04% | |
| Price / MAexp50: | +0.02% | |
| Price / MAexp100: | +0.18% |
News
The last news published on CHF/JPY at the time of the generation of this analysis was as follows:
-
 CHF/JPY Forecast February 26, 2024
-
CHF/JPY Forecast October 5, 2022
-
CHFJPY Potential Swing to the Long Side
-
CHF JPY: Set for another move lower?
About author

Online


Add a comment
Comments
0 comments on the analysis CHF/JPY - 1H