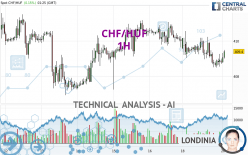
CHF/HUF - 1H - Technical analysis published on 02/20/2024 (GMT)
- 115
- 0
Click here for a new analysis!
- Timeframe : 1H
- - Analysis generated on
- Status : TARGET REACHED

Summary of the analysis

Additional analysis
Quotes
The CHF/HUF rating is 409.40 HUF. On the day, this instrument gained +0.15% with the lowest point at 408.78 HUF and the highest point at 409.49 HUF. The deviation from the price is +0.15% for the low point and -0.02% for the high point.Here is a more detailed summary of the historical variations registered by CHF/HUF:
Near a new HIGH record (1 year)
Type : Bullish
Timeframe : Weekly
Near a new HIGH record (1st january)
Type : Bullish
Timeframe : Weekly
Near a new HIGH record (1 month)
Type : Bullish
Timeframe : Weekly
Technical
A technical analysis in 1H of this CHF/HUF chart shows a bearish trend. 64.29% of the signals given by moving averages are bearish. Caution: as the signals currently given by short-term moving averages are rather neutral, the bearish trend could slow down. An assessment of moving averages reveals several bullish signals that could impact this trend:
Bullish price crossover with Moving Average 20
Type : Bullish
Timeframe : 1 hour
Bullish price crossover with adaptative moving average 100
Type : Bullish
Timeframe : 1 hour
In fact, only 8 technical indicators out of 18 studied are currently bullish. Other results related to technical indicators were also found by the Central Indicators scanner:
RSI indicator is back over 50
Type : Bullish
Timeframe : 1 hour
MACD crosses UP its Moving Average
Type : Bullish
Timeframe : 1 hour
Price is back over the pivot point
Type : Bullish
Timeframe : 1 hour
Price is back under the pivot point
Type : Bearish
Timeframe : Weekly
Momentum indicator is back over 0
Type : Bullish
Timeframe : 1 hour
Williams %R indicator is back over -50
Type : Bullish
Timeframe : 1 hour
The Central Patterns scanner, which studies chart patterns, resistances and supports, has identified these signals:
Near horizontal support
Type : Bullish
Timeframe : 1 hour
Support of channel is broken
Type : Bearish
Timeframe : 1 hour
The Central Candlesticks scanner which studies Japanese candlesticks did not detect anything.
| S3 | S2 | S1 | Price | R1 | R2 | R3 | |
|---|---|---|---|---|---|---|---|
| ProTrendLines | 407.27 | 407.92 | 409.14 | 409.40 | 409.92 | 410.61 | 412.06 |
| Change (%) | -0.52% | -0.36% | -0.06% | - | +0.13% | +0.30% | +0.65% |
| Change | -2.13 | -1.48 | -0.26 | - | +0.52 | +1.21 | +2.66 |
| Level | Intermediate | Minor | Minor | - | Intermediate | Major | Minor |
Pivot points can also be used to set your price objectives. Here is the price situation in relation to pivot points:
| Pivot points | S3 | S2 | S1 | PP | R1 | R2 | R3 |
|---|---|---|---|---|---|---|---|
| Standard | 405.95 | 407.23 | 408.01 | 409.29 | 410.07 | 411.35 | 412.13 |
| Camarilla | 408.23 | 408.42 | 408.61 | 408.80 | 408.99 | 409.18 | 409.37 |
| Woodie | 405.71 | 407.11 | 407.77 | 409.17 | 409.83 | 411.23 | 411.89 |
| Fibonacci | 407.23 | 408.01 | 408.50 | 409.29 | 410.07 | 410.56 | 411.35 |
| Pivot points | S3 | S2 | S1 | PP | R1 | R2 | R3 |
|---|---|---|---|---|---|---|---|
| Standard | 402.81 | 404.87 | 407.44 | 409.50 | 412.07 | 414.13 | 416.70 |
| Camarilla | 408.73 | 409.15 | 409.58 | 410.00 | 410.42 | 410.85 | 411.27 |
| Woodie | 403.06 | 405.00 | 407.69 | 409.63 | 412.32 | 414.26 | 416.95 |
| Fibonacci | 404.87 | 406.64 | 407.74 | 409.50 | 411.27 | 412.37 | 414.13 |
| Pivot points | S3 | S2 | S1 | PP | R1 | R2 | R3 |
|---|---|---|---|---|---|---|---|
| Standard | 387.86 | 395.30 | 403.57 | 411.01 | 419.28 | 426.72 | 434.99 |
| Camarilla | 407.53 | 408.97 | 410.41 | 411.85 | 413.29 | 414.73 | 416.17 |
| Woodie | 388.29 | 395.51 | 404.00 | 411.22 | 419.71 | 426.93 | 435.42 |
| Fibonacci | 395.30 | 401.30 | 405.01 | 411.01 | 417.01 | 420.72 | 426.72 |
Numerical data
The following is the status of the technical indicators and moving averages at the time of publication of this technical analysis:
| RSI (14): | 46.46 | |
| MACD (12,26,9): | -0.2400 | |
| Directional Movement: | 4.27 | |
| AROON (14): | -42.86 | |
| DEMA (21): | 408.87 | |
| Parabolic SAR (0,02-0,02-0,2): | 409.64 | |
| Elder Ray (13): | 0.02 | |
| Super Trend (3,10): | 410.35 | |
| Zig ZAG (10): | 409.19 | |
| VORTEX (21): | 0.9600 | |
| Stochastique (14,3,5): | 34.50 | |
| TEMA (21): | 408.87 | |
| Williams %R (14): | -47.09 | |
| Chande Momentum Oscillator (20): | 0.08 | |
| Repulse (5,40,3): | 0.1400 | |
| ROCnROLL: | -1 | |
| TRIX (15,9): | -0.0100 | |
| Courbe Coppock: | 0.31 |
| MA7: | 409.37 | |
| MA20: | 411.28 | |
| MA50: | 408.11 | |
| MA100: | 403.67 | |
| MAexp7: | 409.06 | |
| MAexp20: | 409.19 | |
| MAexp50: | 409.51 | |
| MAexp100: | 409.73 | |
| Price / MA7: | +0.01% | |
| Price / MA20: | -0.46% | |
| Price / MA50: | +0.32% | |
| Price / MA100: | +1.42% | |
| Price / MAexp7: | +0.08% | |
| Price / MAexp20: | +0.05% | |
| Price / MAexp50: | -0.03% | |
| Price / MAexp100: | -0.08% |
About author
Online


Add a comment
Comments
0 comments on the analysis CHF/HUF - 1H