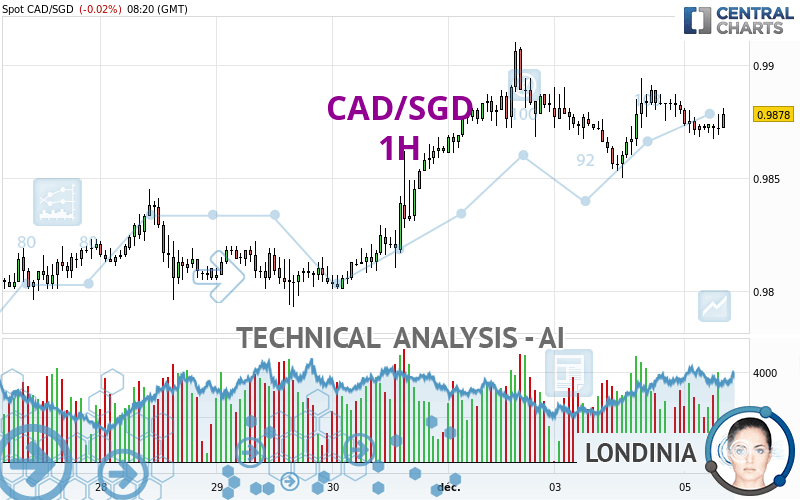
CAD/SGD - 1H - Technical analysis published on 12/05/2023 (GMT)
- 108
- 0
Click here for a new analysis!
- Timeframe : 1H
- - Analysis generated on
- Status : INVALID

Summary of the analysis

Additional analysis
Quotes
CAD/SGD rating 0.9878 SGD. The price is lower by -0.02% since the last closing and was between 0.9867 SGD and 0.9881 SGD. This implies that the price is at +0.11% from its lowest and at -0.03% from its highest.So that you have an overall view of the price change, here is a table showing the variations over several periods:
Near a new LOW record (5 years)
Type : Bearish
Timeframe : Weekly
Near a new HIGH record (1 year)
Type : Bullish
Timeframe : Weekly
Near a new HIGH record (1st january)
Type : Bullish
Timeframe : Weekly
Near a new LOW record (1 month)
Type : Bearish
Timeframe : Weekly
Technical
Technical analysis of this 1H chart of CAD/SGD indicates that the overall trend is bullish. The signals given by moving averages are 78.57% bullish. This bullish trend is slowing down slightly given the slightly bullish signals of short-term moving averages. An assessment of moving averages reveals several bullish signals that could impact this trend:
Moving Average bullish crossovers : MA20 & MA50
Type : Bullish
Timeframe : 1 hour
Bullish price crossover with Moving Average 20
Type : Bullish
Timeframe : 1 hour
Bullish price crossover with Moving Average 50
Type : Bullish
Timeframe : 1 hour
Bullish price crossover with adaptative moving average 20
Type : Bullish
Timeframe : 1 hour
Bullish price crossover with adaptative moving average 50
Type : Bullish
Timeframe : 1 hour
Technical indicators are slightly bullish. There is therefore considerable uncertainty about the continuation of the increase.
Central Indicators, the detector scanner for these technical indicators has recently detected several signals:
RSI indicator is back over 50
Type : Bullish
Timeframe : 1 hour
Price is back over the pivot point
Type : Bullish
Timeframe : 1 hour
Williams %R indicator is back over -50
Type : Bullish
Timeframe : 1 hour
Central Patterns, the market scanner focusing on chart patterns, resistances and supports found these results:
Near support of channel
Type : Bullish
Timeframe : 1 hour
Near support of triangle
Type : Bullish
Timeframe : 1 hour
The Central Candlesticks scanner, specialised in Japanese candlesticks, did not identify any signals.
| S3 | S2 | S1 | Price | R1 | R2 | R3 | |
|---|---|---|---|---|---|---|---|
| ProTrendLines | 0.9829 | 0.9852 | 0.9868 | 0.9878 | 0.9894 | 0.9910 | 0.9958 |
| Change (%) | -0.50% | -0.26% | -0.10% | - | +0.16% | +0.32% | +0.81% |
| Change | -0.0049 | -0.0026 | -0.0010 | - | +0.0016 | +0.0032 | +0.0080 |
| Level | Intermediate | Intermediate | Minor | - | Minor | Intermediate | Major |
To determine price objectives, it is also possible to use the pivot points. Here is the price position in relation to pivot points:
| Pivot points | S3 | S2 | S1 | PP | R1 | R2 | R3 |
|---|---|---|---|---|---|---|---|
| Standard | 0.9811 | 0.9831 | 0.9855 | 0.9875 | 0.9899 | 0.9919 | 0.9943 |
| Camarilla | 0.9868 | 0.9872 | 0.9876 | 0.9880 | 0.9884 | 0.9888 | 0.9892 |
| Woodie | 0.9814 | 0.9832 | 0.9858 | 0.9876 | 0.9902 | 0.9920 | 0.9946 |
| Fibonacci | 0.9831 | 0.9848 | 0.9858 | 0.9875 | 0.9892 | 0.9902 | 0.9919 |
| Pivot points | S3 | S2 | S1 | PP | R1 | R2 | R3 |
|---|---|---|---|---|---|---|---|
| Standard | 0.9696 | 0.9745 | 0.9813 | 0.9862 | 0.9930 | 0.9979 | 1.0047 |
| Camarilla | 0.9850 | 0.9861 | 0.9871 | 0.9882 | 0.9893 | 0.9904 | 0.9914 |
| Woodie | 0.9707 | 0.9750 | 0.9824 | 0.9867 | 0.9941 | 0.9984 | 1.0058 |
| Fibonacci | 0.9745 | 0.9789 | 0.9817 | 0.9862 | 0.9906 | 0.9934 | 0.9979 |
| Pivot points | S3 | S2 | S1 | PP | R1 | R2 | R3 |
|---|---|---|---|---|---|---|---|
| Standard | 0.9537 | 0.9631 | 0.9747 | 0.9841 | 0.9957 | 1.0051 | 1.0167 |
| Camarilla | 0.9804 | 0.9824 | 0.9843 | 0.9862 | 0.9881 | 0.9901 | 0.9920 |
| Woodie | 0.9547 | 0.9637 | 0.9757 | 0.9847 | 0.9967 | 1.0057 | 1.0177 |
| Fibonacci | 0.9631 | 0.9712 | 0.9761 | 0.9841 | 0.9922 | 0.9971 | 1.0051 |
Numerical data
The following are the details of the technical indicators and moving averages that were collected to generate this technical analysis:
| RSI (14): | 53.98 | |
| MACD (12,26,9): | 0.0000 | |
| Directional Movement: | -1.8791 | |
| AROON (14): | -85.7143 | |
| DEMA (21): | 0.9876 | |
| Parabolic SAR (0,02-0,02-0,2): | 0.9893 | |
| Elder Ray (13): | 0.0001 | |
| Super Trend (3,10): | 0.9853 | |
| Zig ZAG (10): | 0.9877 | |
| VORTEX (21): | 1.1158 | |
| Stochastique (14,3,5): | 31.19 | |
| TEMA (21): | 0.9873 | |
| Williams %R (14): | -50.00 | |
| Chande Momentum Oscillator (20): | -0.0007 | |
| Repulse (5,40,3): | 0.0263 | |
| ROCnROLL: | 1 | |
| TRIX (15,9): | 0.0006 | |
| Courbe Coppock: | 0.13 |
| MA7: | 0.9848 | |
| MA20: | 0.9828 | |
| MA50: | 0.9920 | |
| MA100: | 0.9982 | |
| MAexp7: | 0.9875 | |
| MAexp20: | 0.9875 | |
| MAexp50: | 0.9871 | |
| MAexp100: | 0.9857 | |
| Price / MA7: | +0.30% | |
| Price / MA20: | +0.51% | |
| Price / MA50: | -0.42% | |
| Price / MA100: | -1.04% | |
| Price / MAexp7: | +0.03% | |
| Price / MAexp20: | +0.03% | |
| Price / MAexp50: | +0.07% | |
| Price / MAexp100: | +0.21% |
About author
Online


Add a comment
Comments
0 comments on the analysis CAD/SGD - 1H