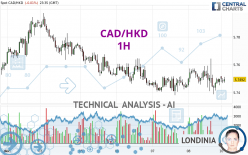
CAD/HKD - 1H - Technical analysis published on 12/10/2023 (GMT)
- 105
- 0
Click here for a new analysis!
- Timeframe : 1H
- - Analysis generated on
- Status : TARGET REACHED

Summary of the analysis

Additional analysis
Quotes
CAD/HKD rating 5.7492 HKD. The price registered a decrease of -0.01% on the session with the lowest point at 5.7467 HKD and the highest point at 5.7515 HKD. The deviation from the price is +0.04% for the low point and -0.04% for the high point.The Central Gaps scanner detects a bullish opening marking the presence of buyers ahead of sellers at the opening but not sufficiently marked to allow the price to register a quotation gap.
Bullish opening
Type : Bullish
Timeframe : Openning
Here is a more detailed summary of the historical variations registered by CAD/HKD:
Near a new HIGH record (1 year)
Type : Bullish
Timeframe : Weekly
Near a new HIGH record (1st january)
Type : Bullish
Timeframe : Weekly
Near a new LOW record (1 month)
Type : Bearish
Timeframe : Weekly
Technical
Technical analysis of this 1H chart of CAD/HKD indicates that the overall trend is bearish. 67.86% of the signals given by moving averages are bearish. Caution: the neutral signals currently given by short-term moving averages show us that the global trend is losing momentum. The Central Indicators scanner detects bullish signals on moving averages that could impact this trend:
Bullish price crossover with Moving Average 20
Type : Bullish
Timeframe : 1 hour
Bullish price crossover with Moving Average 50
Type : Bullish
Timeframe : 1 hour
On the 18 technical indicators analysed, 6 are bullish, 7 are neutral and 5 are bearish. Central Indicators, the detector scanner for these technical indicators has recently detected several signals:
RSI indicator is back over 50
Type : Bullish
Timeframe : 1 hour
MACD crosses UP its Moving Average
Type : Bullish
Timeframe : 1 hour
Price is back over the pivot point
Type : Bullish
Timeframe : 1 hour
The Central Patterns scanner, which studies chart patterns, resistances and supports, has identified these signals:
Near horizontal resistance
Type : Bearish
Timeframe : 1 hour
Near resistance of triangle
Type : Bearish
Timeframe : 1 hour
Resistance of channel is broken
Type : Bullish
Timeframe : 1 hour
The Central Candlesticks scanner, specialised in Japanese candlesticks, did not identify any signals.
| S3 | S2 | S1 | Price | R1 | R2 | R3 | |
|---|---|---|---|---|---|---|---|
| ProTrendLines | 5.7144 | 5.7323 | 5.7425 | 5.7492 | 5.7515 | 5.7644 | 5.7826 |
| Change (%) | -0.61% | -0.29% | -0.12% | - | +0.04% | +0.26% | +0.58% |
| Change | -0.0348 | -0.0169 | -0.0067 | - | +0.0023 | +0.0152 | +0.0334 |
| Level | Minor | Intermediate | Major | - | Major | Minor | Minor |
Attention could also be paid to pivot points to set price objectives:
| Pivot points | S3 | S2 | S1 | PP | R1 | R2 | R3 |
|---|---|---|---|---|---|---|---|
| Standard | 5.7118 | 5.7252 | 5.7374 | 5.7508 | 5.7630 | 5.7764 | 5.7886 |
| Camarilla | 5.7426 | 5.7449 | 5.7473 | 5.7496 | 5.7520 | 5.7543 | 5.7566 |
| Woodie | 5.7112 | 5.7249 | 5.7368 | 5.7505 | 5.7624 | 5.7761 | 5.7880 |
| Fibonacci | 5.7252 | 5.7350 | 5.7410 | 5.7508 | 5.7606 | 5.7666 | 5.7764 |
| Pivot points | S3 | S2 | S1 | PP | R1 | R2 | R3 |
|---|---|---|---|---|---|---|---|
| Standard | 5.6668 | 5.7023 | 5.7260 | 5.7615 | 5.7852 | 5.8207 | 5.8444 |
| Camarilla | 5.7333 | 5.7388 | 5.7442 | 5.7496 | 5.7550 | 5.7605 | 5.7659 |
| Woodie | 5.6608 | 5.6994 | 5.7200 | 5.7586 | 5.7792 | 5.8178 | 5.8384 |
| Fibonacci | 5.7023 | 5.7250 | 5.7389 | 5.7615 | 5.7842 | 5.7981 | 5.8207 |
| Pivot points | S3 | S2 | S1 | PP | R1 | R2 | R3 |
|---|---|---|---|---|---|---|---|
| Standard | 5.5380 | 5.5834 | 5.6722 | 5.7176 | 5.8064 | 5.8518 | 5.9406 |
| Camarilla | 5.7241 | 5.7364 | 5.7487 | 5.7610 | 5.7733 | 5.7856 | 5.7979 |
| Woodie | 5.5597 | 5.5943 | 5.6939 | 5.7285 | 5.8281 | 5.8627 | 5.9623 |
| Fibonacci | 5.5834 | 5.6347 | 5.6663 | 5.7176 | 5.7689 | 5.8005 | 5.8518 |
Numerical data
The following is the status of technical indicators and moving averages registered at the time this technical analysis was created:
| RSI (14): | 51.70 | |
| MACD (12,26,9): | -0.0002 | |
| Directional Movement: | 3.4175 | |
| AROON (14): | -14.2857 | |
| DEMA (21): | 5.7488 | |
| Parabolic SAR (0,02-0,02-0,2): | 5.7608 | |
| Elder Ray (13): | -0.0001 | |
| Super Trend (3,10): | 5.7563 | |
| Zig ZAG (10): | 5.7501 | |
| VORTEX (21): | 0.9487 | |
| Stochastique (14,3,5): | 41.93 | |
| TEMA (21): | 5.7488 | |
| Williams %R (14): | -54.69 | |
| Chande Momentum Oscillator (20): | -0.0029 | |
| Repulse (5,40,3): | 0.0651 | |
| ROCnROLL: | -1 | |
| TRIX (15,9): | -0.0002 | |
| Courbe Coppock: | 0.11 |
| MA7: | 5.7581 | |
| MA20: | 5.7253 | |
| MA50: | 5.7087 | |
| MA100: | 5.7562 | |
| MAexp7: | 5.7491 | |
| MAexp20: | 5.7490 | |
| MAexp50: | 5.7499 | |
| MAexp100: | 5.7521 | |
| Price / MA7: | -0.15% | |
| Price / MA20: | +0.42% | |
| Price / MA50: | +0.71% | |
| Price / MA100: | -0.12% | |
| Price / MAexp7: | +0.00% | |
| Price / MAexp20: | +0.00% | |
| Price / MAexp50: | -0.01% | |
| Price / MAexp100: | -0.05% |
About author
Online


Add a comment
Comments
0 comments on the analysis CAD/HKD - 1H