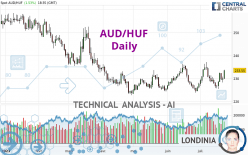
AUD/HUF - Daily - Technical analysis published on 07/25/2023 (GMT)
- 118
- 0
Click here for a new analysis!
- Timeframe : Daily
- - Analysis generated on
- Status : INVALID

Summary of the analysis

Additional analysis
Quotes
AUD/HUF rating 233.56 HUF. On the day, this instrument gained +1.53% with the lowest point at 229.80 HUF and the highest point at 233.85 HUF. The deviation from the price is +1.64% for the low point and -0.12% for the high point.The Central Gaps scanner detects a bearish opening marking the presence of sellers ahead of buyers at the opening but not sufficiently marked to allow the price to register a quotation gap.
Bearish opening
Type : Bearish
Timeframe : Openning
Here is a more detailed summary of the historical variations registered by AUD/HUF:
Near a new LOW record (1 year)
Type : Bearish
Timeframe : Weekly
Near a new LOW record (1st january)
Type : Bearish
Timeframe : Weekly
Near a new LOW record (1 month)
Type : Bearish
Timeframe : Weekly
Technical
Technical analysis of this Daily chart of AUD/HUF indicates that the overall trend is bullish. 64.29% of the signals given by moving averages are bullish. This bullish trend is supported by the strong bullish signals given by short-term moving averages. An assessment of moving averages reveals several bullish signals that could impact this trend:
Bullish price crossover with Moving Average 100
Type : Bullish
Timeframe : Daily
Bullish price crossover with adaptative moving average 50
Type : Bullish
Timeframe : Daily
Bullish price crossover with adaptative moving average 100
Type : Bullish
Timeframe : Daily
In fact, only 9 technical indicators out of 18 studied are currently bullish. Other results related to technical indicators were also found by the Central Indicators scanner:
Pivot points : price is over resistance 1
Type : Neutral
Timeframe : Weekly
Pivot points : price is over resistance 2
Type : Neutral
Timeframe : Daily
Parabolic SAR indicator bullish reversal
Type : Bullish
Timeframe : Daily
Ichimoku : price is over the cloud
Type : Bullish
Timeframe : Daily
Williams %R indicator is back over -50
Type : Bullish
Timeframe : Daily
The Central Patterns scanner, which studies chart patterns, resistances and supports, has identified this signal:
Near horizontal resistance
Type : Bearish
Timeframe : Daily
No result was found by the Central Candlesticks scanner on Japanese candlesticks.
| S3 | S2 | S1 | Price | R1 | R2 | R3 | |
|---|---|---|---|---|---|---|---|
| ProTrendLines | 214.15 | 224.15 | 227.99 | 233.56 | 234.88 | 239.84 | 249.43 |
| Change (%) | -8.31% | -4.03% | -2.38% | - | +0.57% | +2.69% | +6.79% |
| Change | -19.41 | -9.41 | -5.57 | - | +1.32 | +6.28 | +15.87 |
| Level | Major | Major | Major | - | Major | Intermediate | Minor |
Pivot points can also be used to set your price objectives. Here is the price situation in relation to pivot points:
| Pivot points | S3 | S2 | S1 | PP | R1 | R2 | R3 |
|---|---|---|---|---|---|---|---|
| Standard | 226.07 | 227.18 | 228.61 | 229.72 | 231.15 | 232.26 | 233.69 |
| Camarilla | 229.34 | 229.57 | 229.81 | 230.04 | 230.27 | 230.51 | 230.74 |
| Woodie | 226.23 | 227.26 | 228.77 | 229.80 | 231.31 | 232.34 | 233.85 |
| Fibonacci | 227.18 | 228.15 | 228.75 | 229.72 | 230.69 | 231.29 | 232.26 |
| Pivot points | S3 | S2 | S1 | PP | R1 | R2 | R3 |
|---|---|---|---|---|---|---|---|
| Standard | 218.62 | 222.04 | 225.82 | 229.24 | 233.02 | 236.44 | 240.22 |
| Camarilla | 227.63 | 228.29 | 228.95 | 229.61 | 230.27 | 230.93 | 231.59 |
| Woodie | 218.81 | 222.13 | 226.01 | 229.33 | 233.21 | 236.53 | 240.41 |
| Fibonacci | 222.04 | 224.79 | 226.49 | 229.24 | 231.99 | 233.69 | 236.44 |
| Pivot points | S3 | S2 | S1 | PP | R1 | R2 | R3 |
|---|---|---|---|---|---|---|---|
| Standard | 209.68 | 216.75 | 222.22 | 229.29 | 234.76 | 241.83 | 247.30 |
| Camarilla | 224.23 | 225.38 | 226.53 | 227.68 | 228.83 | 229.98 | 231.13 |
| Woodie | 208.87 | 216.35 | 221.41 | 228.89 | 233.95 | 241.43 | 246.49 |
| Fibonacci | 216.75 | 221.54 | 224.50 | 229.29 | 234.08 | 237.04 | 241.83 |
Numerical data
The following is the status of technical indicators and moving averages registered at the time this technical analysis was created:
| RSI (14): | 58.78 | |
| MACD (12,26,9): | 0.3300 | |
| Directional Movement: | 12.49 | |
| AROON (14): | -57.14 | |
| DEMA (21): | 230.31 | |
| Parabolic SAR (0,02-0,02-0,2): | 225.45 | |
| Elder Ray (13): | 1.67 | |
| Super Trend (3,10): | 234.20 | |
| Zig ZAG (10): | 233.62 | |
| VORTEX (21): | 1.0700 | |
| Stochastique (14,3,5): | 47.99 | |
| TEMA (21): | 230.57 | |
| Williams %R (14): | -30.44 | |
| Chande Momentum Oscillator (20): | -1.17 | |
| Repulse (5,40,3): | 2.4400 | |
| ROCnROLL: | 1 | |
| TRIX (15,9): | 0.0100 | |
| Courbe Coppock: | 0.07 |
| MA7: | 229.65 | |
| MA20: | 229.82 | |
| MA50: | 229.44 | |
| MA100: | 231.03 | |
| MAexp7: | 230.62 | |
| MAexp20: | 229.96 | |
| MAexp50: | 230.09 | |
| MAexp100: | 233.46 | |
| Price / MA7: | +1.70% | |
| Price / MA20: | +1.63% | |
| Price / MA50: | +1.80% | |
| Price / MA100: | +1.10% | |
| Price / MAexp7: | +1.27% | |
| Price / MAexp20: | +1.56% | |
| Price / MAexp50: | +1.50% | |
| Price / MAexp100: | +0.03% |
About author
Online


Add a comment
Comments
0 comments on the analysis AUD/HUF - Daily