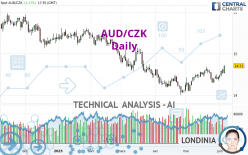
AUD/CZK - Daily - Technical analysis published on 06/06/2023 (GMT)
- 126
- 0
Click here for a new analysis!
- Timeframe : Daily
- - Analysis generated on
- Status : INVALID

Summary of the analysis

Additional analysis
Quotes
AUD/CZK rating 14.71 CZK. The price has increased by +1.17% since the last closing and was between 14.52 CZK and 14.72 CZK. This implies that the price is at +1.31% from its lowest and at -0.07% from its highest.Here is a more detailed summary of the historical variations registered by AUD/CZK:
Near a new LOW record (5 years)
Type : Bearish
Timeframe : Weekly
Near a new LOW record (1 year)
Type : Bearish
Timeframe : Weekly
Near a new LOW record (1st january)
Type : Bearish
Timeframe : Weekly
New HIGH record (1 month)
Type : Bullish
Timeframe : Weekly
Technical
A technical analysis in Daily of this AUD/CZK chart shows a neutral trend. The strong bullish signals currently being given by short-term moving averages could allow the overall trend to return to bullish. An assessment of moving averages reveals a bullish signal that could impact this trend:
Bullish price crossover with adaptative moving average 100
Type : Bullish
Timeframe : Daily
The probability of a further increase is high given the direction of the technical indicators.
Caution: the Central Indicators scanner currently detects an excess:
CCI indicator is overbought : over 100
Type : Neutral
Timeframe : Daily
Williams %R indicator is overbought : over -20
Type : Neutral
Timeframe : Daily
Pivot points : price is over resistance 1
Type : Neutral
Timeframe : Weekly
Pivot points : price is over resistance 2
Type : Neutral
Timeframe : Daily
Aroon indicator bullish trend
Type : Bullish
Timeframe : Daily
Ichimoku : price is over the cloud
Type : Bullish
Timeframe : Daily
Momentum indicator is back over 0
Type : Bullish
Timeframe : Daily
An analysis of the price chart with the Central Patterns scanner (detector of chart patterns and resistances and supports) shows a result that can have an impact on the price change:
Horizontal resistance is broken
Type : Bullish
Timeframe : Daily
No result was found by the Central Candlesticks scanner on Japanese candlesticks.
| S3 | S2 | S1 | Price | R1 | R2 | R3 | |
|---|---|---|---|---|---|---|---|
| ProTrendLines | 11.94 | 14.07 | 14.63 | 14.71 | 15.03 | 15.59 | 16.40 |
| Change (%) | -18.83% | -4.35% | -0.54% | - | +2.18% | +5.98% | +11.49% |
| Change | -2.77 | -0.64 | -0.08 | - | +0.32 | +0.88 | +1.69 |
| Level | Intermediate | Major | Major | - | Intermediate | Intermediate | Minor |
Pivot points can also be used to set your price objectives. Here is the price situation in relation to pivot points:
| Pivot points | S3 | S2 | S1 | PP | R1 | R2 | R3 |
|---|---|---|---|---|---|---|---|
| Standard | 14.37 | 14.44 | 14.49 | 14.56 | 14.61 | 14.68 | 14.73 |
| Camarilla | 14.51 | 14.52 | 14.53 | 14.54 | 14.55 | 14.56 | 14.57 |
| Woodie | 14.36 | 14.44 | 14.48 | 14.56 | 14.60 | 14.68 | 14.72 |
| Fibonacci | 14.44 | 14.49 | 14.51 | 14.56 | 14.61 | 14.63 | 14.68 |
| Pivot points | S3 | S2 | S1 | PP | R1 | R2 | R3 |
|---|---|---|---|---|---|---|---|
| Standard | 14.17 | 14.26 | 14.42 | 14.51 | 14.67 | 14.76 | 14.92 |
| Camarilla | 14.51 | 14.53 | 14.56 | 14.58 | 14.60 | 14.63 | 14.65 |
| Woodie | 14.21 | 14.28 | 14.46 | 14.53 | 14.71 | 14.78 | 14.96 |
| Fibonacci | 14.26 | 14.36 | 14.42 | 14.51 | 14.61 | 14.67 | 14.76 |
| Pivot points | S3 | S2 | S1 | PP | R1 | R2 | R3 |
|---|---|---|---|---|---|---|---|
| Standard | 13.52 | 13.80 | 14.12 | 14.40 | 14.72 | 15.00 | 15.32 |
| Camarilla | 14.27 | 14.32 | 14.38 | 14.43 | 14.49 | 14.54 | 14.60 |
| Woodie | 13.53 | 13.81 | 14.13 | 14.41 | 14.73 | 15.01 | 15.33 |
| Fibonacci | 13.80 | 14.03 | 14.17 | 14.40 | 14.63 | 14.77 | 15.00 |
Numerical data
The following are the details of the technical indicators and moving averages that were collected to generate this technical analysis:
| RSI (14): | 62.71 | |
| MACD (12,26,9): | 0.0400 | |
| Directional Movement: | 13.21 | |
| AROON (14): | 50.00 | |
| DEMA (21): | 14.52 | |
| Parabolic SAR (0,02-0,02-0,2): | 14.32 | |
| Elder Ray (13): | 0.11 | |
| Super Trend (3,10): | 14.27 | |
| Zig ZAG (10): | 14.71 | |
| VORTEX (21): | 1.0800 | |
| Stochastique (14,3,5): | 76.98 | |
| TEMA (21): | 14.58 | |
| Williams %R (14): | -2.38 | |
| Chande Momentum Oscillator (20): | 0.08 | |
| Repulse (5,40,3): | 1.6400 | |
| ROCnROLL: | 1 | |
| TRIX (15,9): | 0.0300 | |
| Courbe Coppock: | 0.01 |
| MA7: | 14.51 | |
| MA20: | 14.50 | |
| MA50: | 14.39 | |
| MA100: | 14.76 | |
| MAexp7: | 14.55 | |
| MAexp20: | 14.48 | |
| MAexp50: | 14.51 | |
| MAexp100: | 14.75 | |
| Price / MA7: | +1.38% | |
| Price / MA20: | +1.45% | |
| Price / MA50: | +2.22% | |
| Price / MA100: | -0.34% | |
| Price / MAexp7: | +1.10% | |
| Price / MAexp20: | +1.59% | |
| Price / MAexp50: | +1.38% | |
| Price / MAexp100: | -0.27% |
About author
Online


Add a comment
Comments
0 comments on the analysis AUD/CZK - Daily