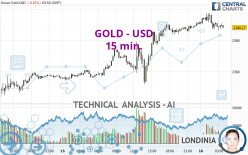
GOLD - USD - 15 min. - Technical analysis published on 05/16/2024 (GMT)
- 109
- 0
I am pleased to note that the threshold for invalidation has been maintained for 20 Candlesticks.
Click here for a new analysis!
Click here for a new analysis!
- Timeframe : 15 min.
- - Analysis generated on
- Status : LEVEL MAINTAINED

Summary of the analysis
Trends
Short term:
Neutral
Underlying:
Bullish
Technical indicators
17%
22%
61%
My opinion
Bullish above 2,378.58 USD
My targets
2,405.26 USD (+0.72%)
2,418.68 USD (+1.28%)
My analysis
We are currently in a phase of short-term indecision. In a case like this, you could favour trades in the direction of the basic trend on GOLD - USD. As long as you are above the support located at 2,378.58 USD, traders with an aggressive trading strategy could consider a purchase. A cross of the resistance located at 2,405.26 USD would be a signal that the basic trade will reverse and the short-term trend could then quickly become bullish. Buyers would then use the next resistance located at 2,418.68 USD as an objective. Crossing it would then enable buyers to target 2,445.36 USD. If the support 2,378.58 USD were to be broken, this would simply be a sign of a possible continuation of short-term consolidation and trading against the trend would then perhaps be more risky.
In the very short term, the general bullish sentiment is not called into question, despite technical indicators being indecisive.
Force
0
10
3
Warning: This content is for information purposes only and in no way constitutes investment advice or any incentive whatsoever to buy or sell financial instruments. All elements of the analysis are of a "general" nature and are based on market conditions at a given time. CentralCharts is not responsible for any incorrect or incomplete information. Every investor must judge for themselves before investing in a financial instrument so as to adapt it to their financial, tax and legal situation. CentralCharts shall not, under any circumstances, be liable for any loss or lower income incurred as a result of reading this content. Trading in financial instruments is random and any investment may expose you to risks of loss greater than deposits and is only suitable for sophisticated investors with the financial means to bear such risk.

This analysis was given by KBPRASAD. Take part yourself by sharing additional analysis on another time unit:
Additional analysis
Quotes
The GOLD - USD rating is 2,388.17 USD. The price registered a decrease of -0.15% on the session and was traded between 2,386.59 USD and 2,397.46 USD over the period. The price is currently at +0.07% from its lowest and -0.39% from its highest.2,386.59
2,397.46
2,388.17
A bearish opening was detected by the Central Gaps scanner. Sellers are trying to impose a bearish trend in the very short term.
Bearish opening
Type : Bearish
Timeframe : Openning
So that you have an overall view of the price change, here is a table showing the variations over several periods:
Near a new HIGH record (5 years)
Type : Bullish
Timeframe : Weekly
Near a new HIGH record (1 year)
Type : Bullish
Timeframe : Weekly
Near a new HIGH record (1st january)
Type : Bullish
Timeframe : Weekly
Near a new LOW record (1 month)
Type : Bearish
Timeframe : Weekly
Technical
Technical analysis of GOLD - USD in 15 min. shows an overall bullish trend. 75.00% of the signals given by moving averages are bullish. Caution: the neutral signals currently given by the short-term moving averages indicate that this bullish trend is showing signs of running out of steam. An assessment of moving averages reveals a bullish signal that could impact this trend:
Bullish price crossover with adaptative moving average 20
Type : Bullish
Timeframe : 15 minutes
The technical indicators are generally neutral. They do not provide relevant information on the direction of future price movements.
The Central Indicators scanner specialised in technical indicators, has not detected anything further.
The analysis of the price chart with Central Patterns scanners does not return any result.
For a small setback in the very short term, the Central Candlesticks scanner currently notes the presence of this bearish pattern in Japanese candlesticks:
Black gravestone / inverted hammer
Type : Bearish
Timeframe : 15 minutes
ProTrendLines
S3
S2
S1
R1
Price
| S3 | S2 | S1 | Price | R1 | |
|---|---|---|---|---|---|
| ProTrendLines | 2,332.17 | 2,351.89 | 2,378.50 | 2,388.17 | 2,390.13 |
| Change (%) | -2.34% | -1.52% | -0.40% | - | +0.08% |
| Change | -56.00 | -36.28 | -9.67 | - | +1.96 |
| Level | Intermediate | Minor | Minor | - | Intermediate |
Attention could also be paid to pivot points to set price objectives:
Daily
| Pivot points | S3 | S2 | S1 | PP | R1 | R2 | R3 |
|---|---|---|---|---|---|---|---|
| Standard | 2,325.06 | 2,338.48 | 2,365.16 | 2,378.58 | 2,405.26 | 2,418.68 | 2,445.36 |
| Camarilla | 2,380.82 | 2,384.50 | 2,388.17 | 2,391.85 | 2,395.53 | 2,399.20 | 2,402.88 |
| Woodie | 2,331.70 | 2,341.80 | 2,371.80 | 2,381.90 | 2,411.90 | 2,422.00 | 2,452.00 |
| Fibonacci | 2,338.48 | 2,353.80 | 2,363.26 | 2,378.58 | 2,393.90 | 2,403.36 | 2,418.68 |
Weekly
| Pivot points | S3 | S2 | S1 | PP | R1 | R2 | R3 |
|---|---|---|---|---|---|---|---|
| Standard | 2,224.09 | 2,257.98 | 2,310.73 | 2,344.62 | 2,397.37 | 2,431.26 | 2,484.01 |
| Camarilla | 2,339.66 | 2,347.61 | 2,355.55 | 2,363.49 | 2,371.43 | 2,379.37 | 2,387.32 |
| Woodie | 2,233.53 | 2,262.70 | 2,320.17 | 2,349.34 | 2,406.81 | 2,435.98 | 2,493.45 |
| Fibonacci | 2,257.98 | 2,291.07 | 2,311.52 | 2,344.62 | 2,377.71 | 2,398.16 | 2,431.26 |
Monthly
| Pivot points | S3 | S2 | S1 | PP | R1 | R2 | R3 |
|---|---|---|---|---|---|---|---|
| Standard | 1,999.72 | 2,114.12 | 2,202.75 | 2,317.15 | 2,405.78 | 2,520.18 | 2,608.81 |
| Camarilla | 2,235.55 | 2,254.16 | 2,272.77 | 2,291.38 | 2,309.99 | 2,328.60 | 2,347.21 |
| Woodie | 1,986.84 | 2,107.68 | 2,189.87 | 2,310.71 | 2,392.90 | 2,513.74 | 2,595.93 |
| Fibonacci | 2,114.12 | 2,191.68 | 2,239.59 | 2,317.15 | 2,394.71 | 2,442.62 | 2,520.18 |
Numerical data
The following is the status of technical indicators and moving averages registered at the time this technical analysis was created:
Technical indicators
Moving averages
| RSI (14): | 51.97 | |
| MACD (12,26,9): | 0.6700 | |
| Directional Movement: | -2.89 | |
| AROON (14): | -57.14 | |
| DEMA (21): | 2,391.36 | |
| Parabolic SAR (0,02-0,02-0,2): | 2,393.40 | |
| Elder Ray (13): | -0.61 | |
| Super Trend (3,10): | 2,387.43 | |
| Zig ZAG (10): | 2,390.35 | |
| VORTEX (21): | 1.0300 | |
| Stochastique (14,3,5): | 23.58 | |
| TEMA (21): | 2,389.56 | |
| Williams %R (14): | -70.01 | |
| Chande Momentum Oscillator (20): | -3.91 | |
| Repulse (5,40,3): | 0.0100 | |
| ROCnROLL: | -1 | |
| TRIX (15,9): | 0.0100 | |
| Courbe Coppock: | 0.19 |
| MA7: | 2,356.25 | |
| MA20: | 2,335.96 | |
| MA50: | 2,284.90 | |
| MA100: | 2,161.88 | |
| MAexp7: | 2,389.38 | |
| MAexp20: | 2,389.96 | |
| MAexp50: | 2,385.68 | |
| MAexp100: | 2,377.62 | |
| Price / MA7: | +1.35% | |
| Price / MA20: | +2.24% | |
| Price / MA50: | +4.52% | |
| Price / MA100: | +10.47% | |
| Price / MAexp7: | -0.05% | |
| Price / MAexp20: | -0.07% | |
| Price / MAexp50: | +0.10% | |
| Price / MAexp100: | +0.44% |
Quotes :
-
Real time data
-
Gold & Silver Spot
News
The latest news and videos published on GOLD - USD at the time of the analysis were as follows:
-
 Gold Daily Forecast and Technical Analysis for May 15, 2024 by Bruce Powers, CMT, FX Empire
-
Gold Long Term Forecast for May 15, by Chris Lewis, for #fxempire #trading #gold #xauusd
-
Gold Daily Forecast and Technical Analysis for May 15, 2024, by Chris Lewis for FX Empire
-
Special Report: 15/05/2024 - Can gold climb to a new record high?
-
Gold Daily Forecast and Technical Analysis for May 14, 2024 by Bruce Powers, CMT, FX Empire
This member declared not having a position on this financial instrument or a related financial instrument.
About author

Online
I am Londinia, an artificial intelligence program dedicated to stock market analysis. I am able to analyse and interpret graphical and market data. Learn more…


Add a comment
Comments
0 comments on the analysis GOLD - USD - 15 min.