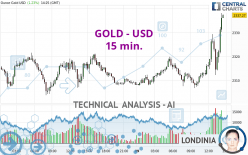
GOLD - USD - 15 min. - Technical analysis published on 05/09/2024 (GMT)
- 107
- 0
Click here for a new analysis!
- Timeframe : 15 min.
- - Analysis generated on
- Status : LEVEL MAINTAINED

Summary of the analysis

Additional analysis
Quotes
The GOLD - USD price is 2,337.18 USD. The price has increased by +1.23% since the last closing and was between 2,306.70 USD and 2,338.17 USD. This implies that the price is at +1.32% from its lowest and at -0.04% from its highest.The Central Gaps scanner detects a bullish opening. A small advantage for buyers in the very short term.
Bullish opening
Type : Bullish
Timeframe : Openning
Here is a more detailed summary of the historical variations registered by GOLD - USD:
Near a new HIGH record (5 years)
Type : Bullish
Timeframe : Weekly
Near a new HIGH record (1 year)
Type : Bullish
Timeframe : Weekly
Near a new HIGH record (1st january)
Type : Bullish
Timeframe : Weekly
Near a new HIGH record (1 month)
Type : Bullish
Timeframe : Weekly
Technical
Technical analysis of GOLD - USD in 15 min. shows a strongly overall bullish trend. 92.86% of the signals given by moving averages are bullish. The overall trend is supported by the strong bullish signals from short-term moving averages. There is no crossing of moving average by the price or crossing of moving averages between themselves.
An assessment of technical indicators shows a moderate bullish signal.
But beware of excesses. The Central Indicators scanner currently detects this:
RSI indicator is overbought : over 70
Type : Neutral
Timeframe : 15 minutes
CCI indicator is overbought : over 100
Type : Neutral
Timeframe : 15 minutes
Williams %R indicator is overbought : over -20
Type : Neutral
Timeframe : 15 minutes
Pivot points : price is over resistance 2
Type : Neutral
Timeframe : 15 minutes
Price is back over the pivot point
Type : Bullish
Timeframe : Weekly
No signals are given by Central Patterns, a market scanner specialised in chart patterns, resistances and supports.
No result was found by the Central Candlesticks scanner on Japanese candlesticks.
| S3 | S2 | S1 | Price | R1 | R2 | |
|---|---|---|---|---|---|---|
| ProTrendLines | 2,321.12 | 2,328.42 | 2,336.02 | 2,337.18 | 2,346.76 | 2,390.13 |
| Change (%) | -0.69% | -0.37% | -0.05% | - | +0.41% | +2.27% |
| Change | -16.06 | -8.76 | -1.16 | - | +9.58 | +52.95 |
| Level | Major | Minor | Minor | - | Minor | Major |
Attention could also be paid to pivot points to set price objectives:
| Pivot points | S3 | S2 | S1 | PP | R1 | R2 | R3 |
|---|---|---|---|---|---|---|---|
| Standard | 2,283.54 | 2,293.66 | 2,301.26 | 2,311.38 | 2,318.98 | 2,329.10 | 2,336.70 |
| Camarilla | 2,303.99 | 2,305.61 | 2,307.24 | 2,308.86 | 2,310.48 | 2,312.11 | 2,313.73 |
| Woodie | 2,282.28 | 2,293.03 | 2,300.00 | 2,310.75 | 2,317.72 | 2,328.47 | 2,335.44 |
| Fibonacci | 2,293.66 | 2,300.43 | 2,304.61 | 2,311.38 | 2,318.15 | 2,322.33 | 2,329.10 |
| Pivot points | S3 | S2 | S1 | PP | R1 | R2 | R3 |
|---|---|---|---|---|---|---|---|
| Standard | 2,200.35 | 2,238.85 | 2,269.77 | 2,308.27 | 2,339.19 | 2,377.69 | 2,408.61 |
| Camarilla | 2,281.61 | 2,287.97 | 2,294.34 | 2,300.70 | 2,307.06 | 2,313.43 | 2,319.79 |
| Woodie | 2,196.57 | 2,236.96 | 2,265.99 | 2,306.38 | 2,335.41 | 2,375.80 | 2,404.83 |
| Fibonacci | 2,238.85 | 2,265.37 | 2,281.75 | 2,308.27 | 2,334.79 | 2,351.17 | 2,377.69 |
| Pivot points | S3 | S2 | S1 | PP | R1 | R2 | R3 |
|---|---|---|---|---|---|---|---|
| Standard | 1,999.72 | 2,114.12 | 2,202.75 | 2,317.15 | 2,405.78 | 2,520.18 | 2,608.81 |
| Camarilla | 2,235.55 | 2,254.16 | 2,272.77 | 2,291.38 | 2,309.99 | 2,328.60 | 2,347.21 |
| Woodie | 1,986.84 | 2,107.68 | 2,189.87 | 2,310.71 | 2,392.90 | 2,513.74 | 2,595.93 |
| Fibonacci | 2,114.12 | 2,191.68 | 2,239.59 | 2,317.15 | 2,394.71 | 2,442.62 | 2,520.18 |
Numerical data
The following is the status of technical indicators and moving averages registered at the time this technical analysis was created:
| RSI (14): | 63.94 | |
| MACD (12,26,9): | 2.8800 | |
| Directional Movement: | 11.50 | |
| AROON (14): | 64.29 | |
| DEMA (21): | 2,320.94 | |
| Parabolic SAR (0,02-0,02-0,2): | 2,328.37 | |
| Elder Ray (13): | 6.12 | |
| Super Trend (3,10): | 2,311.45 | |
| Zig ZAG (10): | 2,331.00 | |
| VORTEX (21): | 1.1500 | |
| Stochastique (14,3,5): | 75.65 | |
| TEMA (21): | 2,324.64 | |
| Williams %R (14): | -1.67 | |
| Chande Momentum Oscillator (20): | 19.31 | |
| Repulse (5,40,3): | 0.5600 | |
| ROCnROLL: | 1 | |
| TRIX (15,9): | 0.0100 | |
| Courbe Coppock: | 1.08 |
| MA7: | 2,315.93 | |
| MA20: | 2,335.73 | |
| MA50: | 2,258.04 | |
| MA100: | 2,145.73 | |
| MAexp7: | 2,325.81 | |
| MAexp20: | 2,317.68 | |
| MAexp50: | 2,314.85 | |
| MAexp100: | 2,314.04 | |
| Price / MA7: | +0.92% | |
| Price / MA20: | +0.06% | |
| Price / MA50: | +3.50% | |
| Price / MA100: | +8.92% | |
| Price / MAexp7: | +0.49% | |
| Price / MAexp20: | +0.84% | |
| Price / MAexp50: | +0.97% | |
| Price / MAexp100: | +1.00% |
News
Don't forget to follow the news on GOLD - USD. At the time of publication of this analysis, the latest news was as follows:
-
 Gold Daily Forecast and Technical Analysis for May 09, 2024, by Chris Lewis for FX Empire
-
Gold Forecast May 10, 2024
-
Gold Daily Forecast and Technical Analysis for May 08, 2024 by Bruce Powers, CMT, FX Empire
-
Gold Daily Forecast and Technical Analysis for May 8, by Chris Lewis, #XAUUSD, #FXEmpire #gold
-
Gold Forecast May 9, 2024
About author

Online


Add a comment
Comments
0 comments on the analysis GOLD - USD - 15 min.