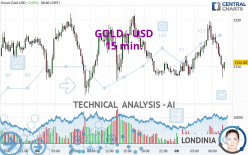
GOLD - USD - 15 min. - Technical analysis published on 05/09/2024 (GMT)
- 116
- 0
Click here for a new analysis!
- Timeframe : 15 min.
- - Analysis generated on
- Status : INVALID

Summary of the analysis

Additional analysis
Quotes
GOLD - USD rating 2,310.88 USD. On the day, this instrument gained +0.09% and was traded between 2,307.57 USD and 2,319.83 USD over the period. The price is currently at +0.14% from its lowest and -0.39% from its highest.The Central Gaps scanner detects a bullish opening marking the presence of buyers ahead of sellers at the opening but not sufficiently marked to allow the price to register a quotation gap.
Bullish opening
Type : Bullish
Timeframe : Openning
Here is a more detailed summary of the historical variations registered by GOLD - USD:
Near a new HIGH record (5 years)
Type : Bullish
Timeframe : Weekly
Near a new HIGH record (1 year)
Type : Bullish
Timeframe : Weekly
Near a new HIGH record (1st january)
Type : Bullish
Timeframe : Weekly
Near a new HIGH record (1 month)
Type : Bullish
Timeframe : Weekly
Technical
Technical analysis of GOLD - USD in 15 min. shows an overall bearish trend. 75.00% of the signals given by moving averages are bearish. The overall trend seems to be showing some signs of weakness, as do the tentative bearish signals from short-term moving averages. The Central Indicators scanner detects bullish and bearish signals on moving averages that could impact this trend:
Bearish trend reversal : adaptative moving average 50
Type : Bearish
Timeframe : 15 minutes
Bearish trend reversal : adaptative moving average 100
Type : Bearish
Timeframe : 15 minutes
Bullish price crossover with Moving Average 50
Type : Bullish
Timeframe : 15 minutes
In fact, 12 technical indicators on 18 studied are currently positioned bearish. But beware of excesses. The Central Indicators scanner currently detects this:
CCI indicator is oversold : under -100
Type : Neutral
Timeframe : 15 minutes
Williams %R indicator is oversold : under -80
Type : Neutral
Timeframe : 15 minutes
MACD indicator is back under 0
Type : Bearish
Timeframe : 15 minutes
Price is back over the pivot point
Type : Bullish
Timeframe : Weekly
No signals are given by Central Patterns, a market scanner specialised in chart patterns, resistances and supports.
Central Candlesticks, the scanner specialised in Japanese candlesticks, detects this inversion signal that could impact the current short-term trend:
Doji
Type : Neutral
Timeframe : 15 minutes
| S3 | S2 | S1 | Price | R1 | R2 | R3 | |
|---|---|---|---|---|---|---|---|
| ProTrendLines | 2,291.38 | 2,303.78 | 2,309.80 | 2,310.88 | 2,321.12 | 2,328.42 | 2,336.02 |
| Change (%) | -0.84% | -0.31% | -0.05% | - | +0.44% | +0.76% | +1.09% |
| Change | -19.50 | -7.10 | -1.08 | - | +10.24 | +17.54 | +25.14 |
| Level | Intermediate | Intermediate | Minor | - | Major | Minor | Minor |
To determine price objectives, it is also possible to use the pivot points. Here is the price position in relation to pivot points:
| Pivot points | S3 | S2 | S1 | PP | R1 | R2 | R3 |
|---|---|---|---|---|---|---|---|
| Standard | 2,283.54 | 2,293.66 | 2,301.26 | 2,311.38 | 2,318.98 | 2,329.10 | 2,336.70 |
| Camarilla | 2,303.99 | 2,305.61 | 2,307.24 | 2,308.86 | 2,310.48 | 2,312.11 | 2,313.73 |
| Woodie | 2,282.28 | 2,293.03 | 2,300.00 | 2,310.75 | 2,317.72 | 2,328.47 | 2,335.44 |
| Fibonacci | 2,293.66 | 2,300.43 | 2,304.61 | 2,311.38 | 2,318.15 | 2,322.33 | 2,329.10 |
| Pivot points | S3 | S2 | S1 | PP | R1 | R2 | R3 |
|---|---|---|---|---|---|---|---|
| Standard | 2,200.35 | 2,238.85 | 2,269.77 | 2,308.27 | 2,339.19 | 2,377.69 | 2,408.61 |
| Camarilla | 2,281.61 | 2,287.97 | 2,294.34 | 2,300.70 | 2,307.06 | 2,313.43 | 2,319.79 |
| Woodie | 2,196.57 | 2,236.96 | 2,265.99 | 2,306.38 | 2,335.41 | 2,375.80 | 2,404.83 |
| Fibonacci | 2,238.85 | 2,265.37 | 2,281.75 | 2,308.27 | 2,334.79 | 2,351.17 | 2,377.69 |
| Pivot points | S3 | S2 | S1 | PP | R1 | R2 | R3 |
|---|---|---|---|---|---|---|---|
| Standard | 1,999.72 | 2,114.12 | 2,202.75 | 2,317.15 | 2,405.78 | 2,520.18 | 2,608.81 |
| Camarilla | 2,235.55 | 2,254.16 | 2,272.77 | 2,291.38 | 2,309.99 | 2,328.60 | 2,347.21 |
| Woodie | 1,986.84 | 2,107.68 | 2,189.87 | 2,310.71 | 2,392.90 | 2,513.74 | 2,595.93 |
| Fibonacci | 2,114.12 | 2,191.68 | 2,239.59 | 2,317.15 | 2,394.71 | 2,442.62 | 2,520.18 |
Numerical data
The following is the status of technical indicators and moving averages registered at the time this technical analysis was created:
| RSI (14): | 38.55 | |
| MACD (12,26,9): | 0.4100 | |
| Directional Movement: | -7.58 | |
| AROON (14): | -57.14 | |
| DEMA (21): | 2,314.50 | |
| Parabolic SAR (0,02-0,02-0,2): | 2,318.08 | |
| Elder Ray (13): | -2.87 | |
| Super Trend (3,10): | 2,317.64 | |
| Zig ZAG (10): | 2,311.27 | |
| VORTEX (21): | 1.0300 | |
| Stochastique (14,3,5): | 12.52 | |
| TEMA (21): | 2,314.21 | |
| Williams %R (14): | -98.97 | |
| Chande Momentum Oscillator (20): | -3.89 | |
| Repulse (5,40,3): | -0.1900 | |
| ROCnROLL: | 2 | |
| TRIX (15,9): | 0.0100 | |
| Courbe Coppock: | 0.09 |
| MA7: | 2,312.61 | |
| MA20: | 2,334.97 | |
| MA50: | 2,257.73 | |
| MA100: | 2,145.57 | |
| MAexp7: | 2,312.72 | |
| MAexp20: | 2,313.53 | |
| MAexp50: | 2,312.77 | |
| MAexp100: | 2,313.19 | |
| Price / MA7: | -0.07% | |
| Price / MA20: | -1.03% | |
| Price / MA50: | +2.35% | |
| Price / MA100: | +7.70% | |
| Price / MAexp7: | -0.08% | |
| Price / MAexp20: | -0.11% | |
| Price / MAexp50: | -0.08% | |
| Price / MAexp100: | -0.10% |
News
The last news published on GOLD - USD at the time of the generation of this analysis was as follows:
-
 Gold Daily Forecast and Technical Analysis for May 08, 2024 by Bruce Powers, CMT, FX Empire
-
Gold Daily Forecast and Technical Analysis for May 8, by Chris Lewis, #XAUUSD, #FXEmpire #gold
-
Gold Forecast May 9, 2024
-
Gold Daily Forecast and Technical Analysis for May 08, 2024, by Chris Lewis for FX Empire
-
Gold Daily Forecast and Technical Analysis for May 07, 2024 by Bruce Powers, CMT, FX Empire
About author

Online


Add a comment
Comments
0 comments on the analysis GOLD - USD - 15 min.