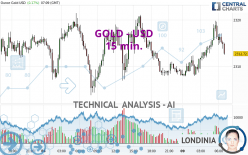
GOLD - USD - 15 min. - Technical analysis published on 05/09/2024 (GMT)
- 82
- 0
- Timeframe : 15 min.
- - Analysis generated on
- Status : NEUTRAL

Summary of the analysis

Additional analysis
Quotes
GOLD - USD rating 2,312.71 USD. The price registered an increase of +0.17% on the session and was between 2,307.84 USD and 2,319.83 USD. This implies that the price is at +0.21% from its lowest and at -0.31% from its highest.The Central Gaps scanner detects a bullish opening. A small advantage for buyers in the very short term.
Bullish opening
Type : Bullish
Timeframe : Openning
A study of price movements over other periods shows the following variations:
Near a new HIGH record (5 years)
Type : Bullish
Timeframe : Weekly
Near a new HIGH record (1 year)
Type : Bullish
Timeframe : Weekly
Near a new HIGH record (1st january)
Type : Bullish
Timeframe : Weekly
Near a new HIGH record (1 month)
Type : Bullish
Timeframe : Weekly
Technical
A technical analysis in 15 min. of this GOLD - USD chart shows a slightly bullish trend. Only 50.00% of the signals given by moving averages are bullish. This slightly bullish trend could return to neutral given the neutral signals also given by short-term moving averages. The Central Indicators scanner detects bearish signals on moving averages that could impact this trend:
Bearish price crossover with adaptative moving average 20
Type : Bearish
Timeframe : 15 minutes
Bearish price crossover with adaptative moving average 100
Type : Bearish
Timeframe : 15 minutes
The technical indicators are generally neutral. They do not provide relevant information on the direction of future price movements.
Central Indicators, the scanner specialised in technical indicators, has identified these signals:
MACD crosses DOWN its Moving Average
Type : Bearish
Timeframe : 15 minutes
Price is back over the pivot point
Type : Bullish
Timeframe : Weekly
Williams %R indicator is back under -50
Type : Bearish
Timeframe : 15 minutes
Central Patterns, the scanner specializing in chart patterns, did not identify any signals.
The presence of these bullish Japanese candlestick patterns detected by Central Candlesticks that could cause a very short term rebound were also noted:
Bullish harami
Type : Bullish
Timeframe : 15 minutes
Bullish harami cross
Type : Bullish
Timeframe : 15 minutes
| S3 | S2 | S1 | Price | R1 | R2 | R3 | |
|---|---|---|---|---|---|---|---|
| ProTrendLines | 2,291.38 | 2,303.78 | 2,309.80 | 2,312.71 | 2,321.12 | 2,328.42 | 2,336.02 |
| Change (%) | -0.92% | -0.39% | -0.13% | - | +0.36% | +0.68% | +1.01% |
| Change | -21.33 | -8.93 | -2.91 | - | +8.41 | +15.71 | +23.31 |
| Level | Intermediate | Intermediate | Minor | - | Major | Minor | Minor |
Attention could also be paid to pivot points to set price objectives:
| Pivot points | S3 | S2 | S1 | PP | R1 | R2 | R3 |
|---|---|---|---|---|---|---|---|
| Standard | 2,283.54 | 2,293.66 | 2,301.26 | 2,311.38 | 2,318.98 | 2,329.10 | 2,336.70 |
| Camarilla | 2,303.99 | 2,305.61 | 2,307.24 | 2,308.86 | 2,310.48 | 2,312.11 | 2,313.73 |
| Woodie | 2,282.28 | 2,293.03 | 2,300.00 | 2,310.75 | 2,317.72 | 2,328.47 | 2,335.44 |
| Fibonacci | 2,293.66 | 2,300.43 | 2,304.61 | 2,311.38 | 2,318.15 | 2,322.33 | 2,329.10 |
| Pivot points | S3 | S2 | S1 | PP | R1 | R2 | R3 |
|---|---|---|---|---|---|---|---|
| Standard | 2,200.35 | 2,238.85 | 2,269.77 | 2,308.27 | 2,339.19 | 2,377.69 | 2,408.61 |
| Camarilla | 2,281.61 | 2,287.97 | 2,294.34 | 2,300.70 | 2,307.06 | 2,313.43 | 2,319.79 |
| Woodie | 2,196.57 | 2,236.96 | 2,265.99 | 2,306.38 | 2,335.41 | 2,375.80 | 2,404.83 |
| Fibonacci | 2,238.85 | 2,265.37 | 2,281.75 | 2,308.27 | 2,334.79 | 2,351.17 | 2,377.69 |
| Pivot points | S3 | S2 | S1 | PP | R1 | R2 | R3 |
|---|---|---|---|---|---|---|---|
| Standard | 1,999.72 | 2,114.12 | 2,202.75 | 2,317.15 | 2,405.78 | 2,520.18 | 2,608.81 |
| Camarilla | 2,235.55 | 2,254.16 | 2,272.77 | 2,291.38 | 2,309.99 | 2,328.60 | 2,347.21 |
| Woodie | 1,986.84 | 2,107.68 | 2,189.87 | 2,310.71 | 2,392.90 | 2,513.74 | 2,595.93 |
| Fibonacci | 2,114.12 | 2,191.68 | 2,239.59 | 2,317.15 | 2,394.71 | 2,442.62 | 2,520.18 |
Numerical data
The following is the status of technical indicators and moving averages registered at the time this technical analysis was created:
| RSI (14): | 63.76 | |
| MACD (12,26,9): | 1.6900 | |
| Directional Movement: | 10.29 | |
| AROON (14): | 71.43 | |
| DEMA (21): | 2,316.23 | |
| Parabolic SAR (0,02-0,02-0,2): | 2,319.62 | |
| Elder Ray (13): | 0.81 | |
| Super Trend (3,10): | 2,312.38 | |
| Zig ZAG (10): | 2,315.53 | |
| VORTEX (21): | 1.1300 | |
| Stochastique (14,3,5): | 63.13 | |
| TEMA (21): | 2,317.45 | |
| Williams %R (14): | -59.12 | |
| Chande Momentum Oscillator (20): | 2.65 | |
| Repulse (5,40,3): | -0.0700 | |
| ROCnROLL: | -1 | |
| TRIX (15,9): | 0.0100 | |
| Courbe Coppock: | 0.46 |
| MA7: | 2,313.25 | |
| MA20: | 2,335.26 | |
| MA50: | 2,257.84 | |
| MA100: | 2,145.62 | |
| MAexp7: | 2,315.45 | |
| MAexp20: | 2,314.41 | |
| MAexp50: | 2,312.95 | |
| MAexp100: | 2,313.29 | |
| Price / MA7: | -0.02% | |
| Price / MA20: | -0.97% | |
| Price / MA50: | +2.43% | |
| Price / MA100: | +7.79% | |
| Price / MAexp7: | -0.12% | |
| Price / MAexp20: | -0.07% | |
| Price / MAexp50: | -0.01% | |
| Price / MAexp100: | -0.03% |
News
The latest news and videos published on GOLD - USD at the time of the analysis were as follows:
-
 Gold Daily Forecast and Technical Analysis for May 08, 2024 by Bruce Powers, CMT, FX Empire
-
Gold Daily Forecast and Technical Analysis for May 8, by Chris Lewis, #XAUUSD, #FXEmpire #gold
-
Gold Forecast May 9, 2024
-
Gold Daily Forecast and Technical Analysis for May 08, 2024, by Chris Lewis for FX Empire
-
Gold Daily Forecast and Technical Analysis for May 07, 2024 by Bruce Powers, CMT, FX Empire
About author

Online


Add a comment
Comments
0 comments on the analysis GOLD - USD - 15 min.