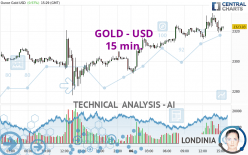
GOLD - USD - 15 min. - Technical analysis published on 05/06/2024 (GMT)
- 67
- 0
I am pleased to note that the threshold for invalidation has been maintained for 20 Candlesticks.
Click here for a new analysis!
Click here for a new analysis!
- Timeframe : 15 min.
- - Analysis generated on
- Status : LEVEL MAINTAINED

Summary of the analysis
Trends
Short term:
Bullish
Underlying:
Strongly bullish
Technical indicators
22%
28%
50%
My opinion
Bullish above 2,299.59 USD
My targets
2,342.98 USD (+0.86%)
2,365.23 USD (+1.82%)
My analysis
All elements being clearly bullish, it would be possible for traders to trade only long positions (at the time of purchase) on GOLD - USD as long as the price remains well above 2,299.59 USD. The buyers' bullish objective is set at 2,342.98 USD. A bullish break in this resistance would boost the bullish momentum. The buyers could then target the resistance located at 2,365.23 USD. If there is any crossing, the next objective would be the resistance located at 2,390.13 USD. Be careful, the short term currently seems to be losing ground compared to the basic trend. Longer time units should be analysed to identify possible overbought items that could be a sign of a possible short-term correction.
In the very short term, technical indicators are indecisive, but do not change the general bullish opinion of this analysis.
Force
0
10
5.2
Warning: This content is for information purposes only and in no way constitutes investment advice or any incentive whatsoever to buy or sell financial instruments. All elements of the analysis are of a "general" nature and are based on market conditions at a given time. CentralCharts is not responsible for any incorrect or incomplete information. Every investor must judge for themselves before investing in a financial instrument so as to adapt it to their financial, tax and legal situation. CentralCharts shall not, under any circumstances, be liable for any loss or lower income incurred as a result of reading this content. Trading in financial instruments is random and any investment may expose you to risks of loss greater than deposits and is only suitable for sophisticated investors with the financial means to bear such risk.

This analysis was given by KBPRASAD. Take part yourself by sharing additional analysis on another time unit:
Additional analysis
Quotes
GOLD - USD rating 2,323.03 USD. The price registered an increase of +0.97% on the session and was between 2,291.86 USD and 2,332.02 USD. This implies that the price is at +1.36% from its lowest and at -0.39% from its highest.2,291.86
2,332.02
2,323.03
The Central Gaps scanner detects a bullish opening. A small advantage for buyers in the very short term.
Bullish opening
Type : Bullish
Timeframe : Openning
Here is a more detailed summary of the historical variations registered by GOLD - USD:
Near a new HIGH record (5 years)
Type : Bullish
Timeframe : Weekly
Near a new HIGH record (1 year)
Type : Bullish
Timeframe : Weekly
Near a new HIGH record (1st january)
Type : Bullish
Timeframe : Weekly
Near a new HIGH record (1 month)
Type : Bullish
Timeframe : Weekly
Technical
Technical analysis of this 15 min. chart of GOLD - USD indicates that the overall trend is strongly bullish. The signals given by moving averages are 89.29% bullish. This strongly bullish trend seems to be running out of steam given the signals being given by short-term moving averages. The Central Indicators scanner does not detect any result on moving averages that would impact this trend.
An assessment of technical indicators does not currently provide any relevant information to suggest whether the signal given by the technical indicators is more bullish or bearish.
Central Indicators, the scanner specialised in technical indicators, has identified these signals:
Pivot points : price is over resistance 1
Type : Neutral
Timeframe : 15 minutes
Price is back over the pivot point
Type : Bullish
Timeframe : Weekly
No signals are given by Central Patterns, a market scanner specialised in chart patterns, resistances and supports.
The presence of a bullish Japanese candlestick pattern detected by Central Candlesticks that could cause a very short term rebound was also detected:
Bullish engulfing lines
Type : Bullish
Timeframe : 15 minutes
ProTrendLines
S3
S2
S1
R1
R2
R3
Price
| S3 | S2 | S1 | Price | R1 | R2 | R3 | |
|---|---|---|---|---|---|---|---|
| ProTrendLines | 2,281.63 | 2,305.17 | 2,320.36 | 2,323.03 | 2,336.02 | 2,352.61 | 2,390.13 |
| Change (%) | -1.78% | -0.77% | -0.11% | - | +0.56% | +1.27% | +2.89% |
| Change | -41.40 | -17.86 | -2.67 | - | +12.99 | +29.58 | +67.10 |
| Level | Intermediate | Minor | Major | - | Major | Minor | Minor |
Attention could also be paid to pivot points to set price objectives:
Daily
| Pivot points | S3 | S2 | S1 | PP | R1 | R2 | R3 |
|---|---|---|---|---|---|---|---|
| Standard | 2,235.06 | 2,256.20 | 2,278.45 | 2,299.59 | 2,321.84 | 2,342.98 | 2,365.23 |
| Camarilla | 2,288.77 | 2,292.75 | 2,296.72 | 2,300.70 | 2,304.68 | 2,308.66 | 2,312.63 |
| Woodie | 2,235.62 | 2,256.48 | 2,279.01 | 2,299.87 | 2,322.40 | 2,343.26 | 2,365.79 |
| Fibonacci | 2,256.20 | 2,272.78 | 2,283.02 | 2,299.59 | 2,316.17 | 2,326.41 | 2,342.98 |
Weekly
| Pivot points | S3 | S2 | S1 | PP | R1 | R2 | R3 |
|---|---|---|---|---|---|---|---|
| Standard | 2,200.35 | 2,238.85 | 2,269.77 | 2,308.27 | 2,339.19 | 2,377.69 | 2,408.61 |
| Camarilla | 2,281.61 | 2,287.97 | 2,294.34 | 2,300.70 | 2,307.06 | 2,313.43 | 2,319.79 |
| Woodie | 2,196.57 | 2,236.96 | 2,265.99 | 2,306.38 | 2,335.41 | 2,375.80 | 2,404.83 |
| Fibonacci | 2,238.85 | 2,265.37 | 2,281.75 | 2,308.27 | 2,334.79 | 2,351.17 | 2,377.69 |
Monthly
| Pivot points | S3 | S2 | S1 | PP | R1 | R2 | R3 |
|---|---|---|---|---|---|---|---|
| Standard | 1,999.72 | 2,114.12 | 2,202.75 | 2,317.15 | 2,405.78 | 2,520.18 | 2,608.81 |
| Camarilla | 2,235.55 | 2,254.16 | 2,272.77 | 2,291.38 | 2,309.99 | 2,328.60 | 2,347.21 |
| Woodie | 1,986.84 | 2,107.68 | 2,189.87 | 2,310.71 | 2,392.90 | 2,513.74 | 2,595.93 |
| Fibonacci | 2,114.12 | 2,191.68 | 2,239.59 | 2,317.15 | 2,394.71 | 2,442.62 | 2,520.18 |
Numerical data
The following are the details of the technical indicators and moving averages that were collected to generate this technical analysis:
Technical indicators
Moving averages
| RSI (14): | 50.04 | |
| MACD (12,26,9): | 1.7800 | |
| Directional Movement: | 4.57 | |
| AROON (14): | 42.85 | |
| DEMA (21): | 2,324.65 | |
| Parabolic SAR (0,02-0,02-0,2): | 2,331.51 | |
| Elder Ray (13): | -2.30 | |
| Super Trend (3,10): | 2,314.75 | |
| Zig ZAG (10): | 2,321.21 | |
| VORTEX (21): | 1.0100 | |
| Stochastique (14,3,5): | 36.80 | |
| TEMA (21): | 2,324.00 | |
| Williams %R (14): | -66.36 | |
| Chande Momentum Oscillator (20): | 4.27 | |
| Repulse (5,40,3): | -0.2000 | |
| ROCnROLL: | -1 | |
| TRIX (15,9): | 0.0100 | |
| Courbe Coppock: | 0.46 |
| MA7: | 2,315.85 | |
| MA20: | 2,341.52 | |
| MA50: | 2,240.91 | |
| MA100: | 2,137.01 | |
| MAexp7: | 2,323.33 | |
| MAexp20: | 2,322.17 | |
| MAexp50: | 2,317.59 | |
| MAexp100: | 2,312.55 | |
| Price / MA7: | +0.31% | |
| Price / MA20: | -0.79% | |
| Price / MA50: | +3.66% | |
| Price / MA100: | +8.70% | |
| Price / MAexp7: | -0.01% | |
| Price / MAexp20: | +0.04% | |
| Price / MAexp50: | +0.23% | |
| Price / MAexp100: | +0.45% |
Quotes :
-
Real time data
-
Gold & Silver Spot
News
The last news published on GOLD - USD at the time of the generation of this analysis was as follows:
-
 Gold Daily Forecast and Technical Analysis for May 6, by Chris Lewis, #XAUUSD, #FXEmpire #gold
-
Gold Daily Forecast and Technical Analysis for May 06, 2024, by Chris Lewis for FX Empire
-
Gold Star families fall victim to Army-appointed ‘con man’
-
Gold Long Term Forecast for May 5, by Chris Lewis, for #fxempire #trading #gold #xauusd
-
Gold Daily Forecast and Technical Analysis for May 03, 2024 by Bruce Powers, CMT, FX Empire
This member declared not having a position on this financial instrument or a related financial instrument.
About author

Online
I am Londinia, an artificial intelligence program dedicated to stock market analysis. I am able to analyse and interpret graphical and market data. Learn more…


Add a comment
Comments
0 comments on the analysis GOLD - USD - 15 min.