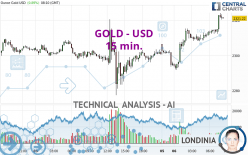
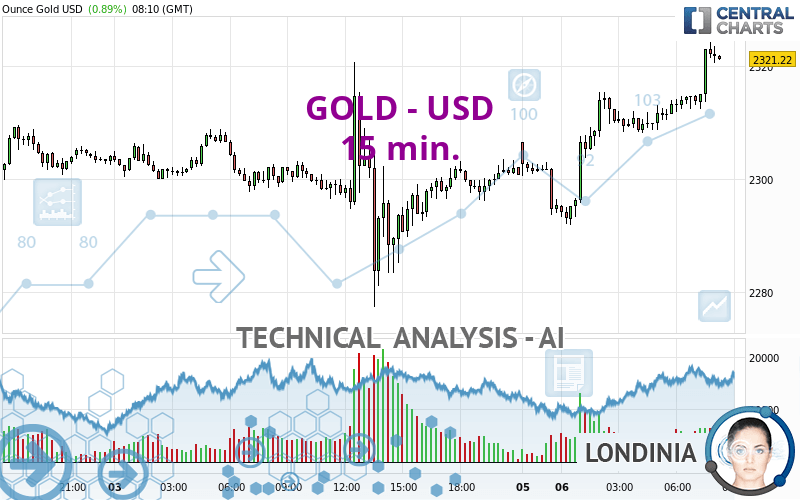
GOLD - USD - 15 min. - Technical analysis published on 05/06/2024 (GMT)
- 116
- 0
Click here for a new analysis!
- Timeframe : 15 min.
- - Analysis generated on
- Status : LEVEL MAINTAINED
Summary of the analysis

Additional analysis
Quotes
GOLD - USD rating 2,321.22 USD. On the day, this instrument gained +0.89% with the lowest point at 2,291.86 USD and the highest point at 2,324.25 USD. The deviation from the price is +1.28% for the low point and -0.13% for the high point.The Central Gaps scanner detects a bullish opening. A small advantage for buyers in the very short term.
Bullish opening
Type : Bullish
Timeframe : Openning
So that you have an overall view of the price change, here is a table showing the variations over several periods:
Near a new HIGH record (5 years)
Type : Bullish
Timeframe : Weekly
Near a new HIGH record (1 year)
Type : Bullish
Timeframe : Weekly
Near a new HIGH record (1st january)
Type : Bullish
Timeframe : Weekly
Near a new HIGH record (1 month)
Type : Bullish
Timeframe : Weekly
Technical
A technical analysis in 15 min. of this GOLD - USD chart shows a strongly bullish trend. The signals given by the moving averages are 92.86% bullish. This strong bullish trend is confirmed by the strong signals currently being given by short-term moving averages. The Central Indicators scanner does not detect any result on moving averages that would impact this trend.
The probability of a further increase is high given the direction of the technical indicators.
Caution: the Central Indicators scanner currently detects an excess:
RSI indicator is overbought : over 70
Type : Neutral
Timeframe : 15 minutes
CCI indicator is overbought : over 100
Type : Neutral
Timeframe : 15 minutes
Previous candle closed over Bollinger bands
Type : Neutral
Timeframe : 15 minutes
Williams %R indicator is overbought : over -20
Type : Neutral
Timeframe : 15 minutes
Pivot points : price is over resistance 1
Type : Neutral
Timeframe : 15 minutes
Price is back over the pivot point
Type : Bullish
Timeframe : Weekly
The analysis of the price chart with Central Patterns scanners does not return any result.
The Central Candlesticks scanner which studies Japanese candlesticks did not detect anything.
| S3 | S2 | S1 | Price | R1 | R2 | R3 | |
|---|---|---|---|---|---|---|---|
| ProTrendLines | 2,281.63 | 2,305.17 | 2,320.36 | 2,321.22 | 2,336.02 | 2,352.61 | 2,390.13 |
| Change (%) | -1.71% | -0.69% | -0.04% | - | +0.64% | +1.35% | +2.97% |
| Change | -39.59 | -16.05 | -0.86 | - | +14.80 | +31.39 | +68.91 |
| Level | Intermediate | Minor | Major | - | Major | Minor | Minor |
Attention could also be paid to pivot points to set price objectives:
| Pivot points | S3 | S2 | S1 | PP | R1 | R2 | R3 |
|---|---|---|---|---|---|---|---|
| Standard | 2,235.06 | 2,256.20 | 2,278.45 | 2,299.59 | 2,321.84 | 2,342.98 | 2,365.23 |
| Camarilla | 2,288.77 | 2,292.75 | 2,296.72 | 2,300.70 | 2,304.68 | 2,308.66 | 2,312.63 |
| Woodie | 2,235.62 | 2,256.48 | 2,279.01 | 2,299.87 | 2,322.40 | 2,343.26 | 2,365.79 |
| Fibonacci | 2,256.20 | 2,272.78 | 2,283.02 | 2,299.59 | 2,316.17 | 2,326.41 | 2,342.98 |
| Pivot points | S3 | S2 | S1 | PP | R1 | R2 | R3 |
|---|---|---|---|---|---|---|---|
| Standard | 2,200.35 | 2,238.85 | 2,269.77 | 2,308.27 | 2,339.19 | 2,377.69 | 2,408.61 |
| Camarilla | 2,281.61 | 2,287.97 | 2,294.34 | 2,300.70 | 2,307.06 | 2,313.43 | 2,319.79 |
| Woodie | 2,196.57 | 2,236.96 | 2,265.99 | 2,306.38 | 2,335.41 | 2,375.80 | 2,404.83 |
| Fibonacci | 2,238.85 | 2,265.37 | 2,281.75 | 2,308.27 | 2,334.79 | 2,351.17 | 2,377.69 |
| Pivot points | S3 | S2 | S1 | PP | R1 | R2 | R3 |
|---|---|---|---|---|---|---|---|
| Standard | 1,999.72 | 2,114.12 | 2,202.75 | 2,317.15 | 2,405.78 | 2,520.18 | 2,608.81 |
| Camarilla | 2,235.55 | 2,254.16 | 2,272.77 | 2,291.38 | 2,309.99 | 2,328.60 | 2,347.21 |
| Woodie | 1,986.84 | 2,107.68 | 2,189.87 | 2,310.71 | 2,392.90 | 2,513.74 | 2,595.93 |
| Fibonacci | 2,114.12 | 2,191.68 | 2,239.59 | 2,317.15 | 2,394.71 | 2,442.62 | 2,520.18 |
Numerical data
The following is the status of technical indicators and moving averages registered at the time this technical analysis was created:
| RSI (14): | 69.87 | |
| MACD (12,26,9): | 2.8600 | |
| Directional Movement: | 20.86 | |
| AROON (14): | 100.00 | |
| DEMA (21): | 2,316.01 | |
| Parabolic SAR (0,02-0,02-0,2): | 2,309.45 | |
| Elder Ray (13): | 4.31 | |
| Super Trend (3,10): | 2,309.53 | |
| Zig ZAG (10): | 2,317.94 | |
| VORTEX (21): | 1.0700 | |
| Stochastique (14,3,5): | 87.47 | |
| TEMA (21): | 2,317.17 | |
| Williams %R (14): | -0.28 | |
| Chande Momentum Oscillator (20): | 14.02 | |
| Repulse (5,40,3): | 0.4600 | |
| ROCnROLL: | 1 | |
| TRIX (15,9): | 0.0200 | |
| Courbe Coppock: | 0.49 |
| MA7: | 2,315.78 | |
| MA20: | 2,341.56 | |
| MA50: | 2,240.93 | |
| MA100: | 2,137.01 | |
| MAexp7: | 2,318.00 | |
| MAexp20: | 2,311.80 | |
| MAexp50: | 2,307.31 | |
| MAexp100: | 2,304.85 | |
| Price / MA7: | +0.23% | |
| Price / MA20: | -0.87% | |
| Price / MA50: | +3.58% | |
| Price / MA100: | +8.62% | |
| Price / MAexp7: | +0.14% | |
| Price / MAexp20: | +0.41% | |
| Price / MAexp50: | +0.60% | |
| Price / MAexp100: | +0.71% |
News
The latest news and videos published on GOLD - USD at the time of the analysis were as follows:
-
 Gold Star families fall victim to Army-appointed ‘con man’
-
Gold Long Term Forecast for May 5, by Chris Lewis, for #fxempire #trading #gold #xauusd
-
Gold Daily Forecast and Technical Analysis for May 03, 2024 by Bruce Powers, CMT, FX Empire
-
Gold Forecast May 6, 2024
-
Gold Long Term Forecast and Technical Analysis for May 03, 2024, by Chris Lewis for FX Empire
About author

Online


Add a comment
Comments
0 comments on the analysis GOLD - USD - 15 min.