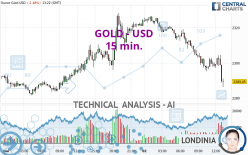
GOLD - USD - 15 min. - Technical analysis published on 05/02/2024 (GMT)
- 98
- 0
Click here for a new analysis!
- Timeframe : 15 min.
- - Analysis generated on
- Status : LEVEL MAINTAINED

Summary of the analysis

Additional analysis
Quotes
The GOLD - USD price is 2,289.45 USD. On the day, this instrument lost -1.48% with the lowest point at 2,286.15 USD and the highest point at 2,326.51 USD. The deviation from the price is +0.14% for the low point and -1.59% for the high point.A bullish opening was detected by the Central Gaps scanner. Buyers are trying to impose a bullish momentum in the very short term.
Bullish opening
Type : Bullish
Timeframe : Openning
So that you have an overall view of the price change, here is a table showing the variations over several periods:
Near a new HIGH record (5 years)
Type : Bullish
Timeframe : Weekly
Near a new HIGH record (1 year)
Type : Bullish
Timeframe : Weekly
Near a new HIGH record (1st january)
Type : Bullish
Timeframe : Weekly
Near a new HIGH record (1 month)
Type : Bullish
Timeframe : Weekly
Technical
A technical analysis in 15 min. of this GOLD - USD chart shows a sharp bearish trend. 89.29% of the signals given by moving averages are bearish. This strongly bearish trend is supported by the strong bearish signals given by short-term moving averages. There is no crossing of moving average by the price or crossing of moving averages between themselves.
In fact, according to the parameters integrated into the Central Analyzer system, only 9 technical indicators out of 18 analysed are currently bearish. But beware of excesses. The Central Indicators scanner currently detects this:
RSI indicator is oversold : under 30
Type : Neutral
Timeframe : 15 minutes
CCI indicator is oversold : under -100
Type : Neutral
Timeframe : 15 minutes
Williams %R indicator is oversold : under -80
Type : Neutral
Timeframe : 15 minutes
Pivot points : price is under support 1
Type : Neutral
Timeframe : 15 minutes
Pivot points : price is under support 1
Type : Neutral
Timeframe : Weekly
MACD crosses DOWN its Moving Average
Type : Bearish
Timeframe : 15 minutes
Central Patterns, the scanner specializing in chart patterns, did not identify any signals.
The presence of a bearish pattern in Japanese candlesticks detected by Central Candlesticks that could cause a correction in the very short term was also detected:
Three black crows
Type : Bearish
Timeframe : 15 minutes
| S3 | S2 | S1 | Price | R1 | R2 | R3 | |
|---|---|---|---|---|---|---|---|
| ProTrendLines | 2,049.28 | 2,183.68 | 2,281.63 | 2,289.45 | 2,291.48 | 2,305.17 | 2,316.32 |
| Change (%) | -10.49% | -4.62% | -0.34% | - | +0.09% | +0.69% | +1.17% |
| Change | -240.17 | -105.77 | -7.82 | - | +2.03 | +15.72 | +26.87 |
| Level | Major | Minor | Minor | - | Minor | Minor | Intermediate |
To determine price objectives, it is also possible to use the pivot points. Here is the price position in relation to pivot points:
| Pivot points | S3 | S2 | S1 | PP | R1 | R2 | R3 |
|---|---|---|---|---|---|---|---|
| Standard | 2,247.46 | 2,264.55 | 2,294.19 | 2,311.28 | 2,340.92 | 2,358.01 | 2,387.65 |
| Camarilla | 2,310.99 | 2,315.27 | 2,319.56 | 2,323.84 | 2,328.12 | 2,332.41 | 2,336.69 |
| Woodie | 2,253.75 | 2,267.69 | 2,300.48 | 2,314.42 | 2,347.21 | 2,361.15 | 2,393.94 |
| Fibonacci | 2,264.55 | 2,282.40 | 2,293.43 | 2,311.28 | 2,329.13 | 2,340.16 | 2,358.01 |
| Pivot points | S3 | S2 | S1 | PP | R1 | R2 | R3 |
|---|---|---|---|---|---|---|---|
| Standard | 2,187.28 | 2,239.38 | 2,287.70 | 2,339.80 | 2,388.12 | 2,440.22 | 2,488.54 |
| Camarilla | 2,308.41 | 2,317.61 | 2,326.82 | 2,336.02 | 2,345.23 | 2,354.43 | 2,363.64 |
| Woodie | 2,185.39 | 2,238.44 | 2,285.81 | 2,338.86 | 2,386.23 | 2,439.28 | 2,486.65 |
| Fibonacci | 2,239.38 | 2,277.74 | 2,301.44 | 2,339.80 | 2,378.16 | 2,401.86 | 2,440.22 |
| Pivot points | S3 | S2 | S1 | PP | R1 | R2 | R3 |
|---|---|---|---|---|---|---|---|
| Standard | 1,999.72 | 2,114.12 | 2,202.75 | 2,317.15 | 2,405.78 | 2,520.18 | 2,608.81 |
| Camarilla | 2,235.55 | 2,254.16 | 2,272.77 | 2,291.38 | 2,309.99 | 2,328.60 | 2,347.21 |
| Woodie | 1,986.84 | 2,107.68 | 2,189.87 | 2,310.71 | 2,392.90 | 2,513.74 | 2,595.93 |
| Fibonacci | 2,114.12 | 2,191.68 | 2,239.59 | 2,317.15 | 2,394.71 | 2,442.62 | 2,520.18 |
Numerical data
The following is the status of the technical indicators and moving averages at the time of publication of this technical analysis:
| RSI (14): | 30.43 | |
| MACD (12,26,9): | -3.5500 | |
| Directional Movement: | -13.84 | |
| AROON (14): | -7.14 | |
| DEMA (21): | 2,296.25 | |
| Parabolic SAR (0,02-0,02-0,2): | 2,304.53 | |
| Elder Ray (13): | -5.81 | |
| Super Trend (3,10): | 2,306.44 | |
| Zig ZAG (10): | 2,290.93 | |
| VORTEX (21): | 0.7800 | |
| Stochastique (14,3,5): | 28.55 | |
| TEMA (21): | 2,294.83 | |
| Williams %R (14): | -87.71 | |
| Chande Momentum Oscillator (20): | -6.24 | |
| Repulse (5,40,3): | -0.4600 | |
| ROCnROLL: | 2 | |
| TRIX (15,9): | -0.0300 | |
| Courbe Coppock: | 0.45 |
| MA7: | 2,317.22 | |
| MA20: | 2,343.06 | |
| MA50: | 2,229.47 | |
| MA100: | 2,130.84 | |
| MAexp7: | 2,294.82 | |
| MAexp20: | 2,301.39 | |
| MAexp50: | 2,306.62 | |
| MAexp100: | 2,307.85 | |
| Price / MA7: | -1.20% | |
| Price / MA20: | -2.29% | |
| Price / MA50: | +2.69% | |
| Price / MA100: | +7.44% | |
| Price / MAexp7: | -0.23% | |
| Price / MAexp20: | -0.52% | |
| Price / MAexp50: | -0.74% | |
| Price / MAexp100: | -0.80% |
News
Don't forget to follow the news on GOLD - USD. At the time of publication of this analysis, the latest news was as follows:
-
 Gold Daily Forecast and Technical Analysis for May 02, 2024, by Chris Lewis for FX Empire
-
Gold Daily Forecast and Technical Analysis for May 01, 2024 by Bruce Powers, CMT, FX Empire
-
Gold Daily Forecast and Technical Analysis for May 1 by Chris Lewis, #XAUUSD, #FXEmpire #gold
-
Gold Daily Forecast and Technical Analysis for May 01, 2024, by Chris Lewis for FX Empire
-
Trading the trend: Time to go long gold?
About author

Online


Add a comment
Comments
0 comments on the analysis GOLD - USD - 15 min.