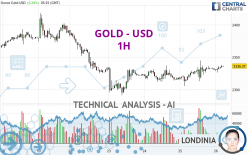
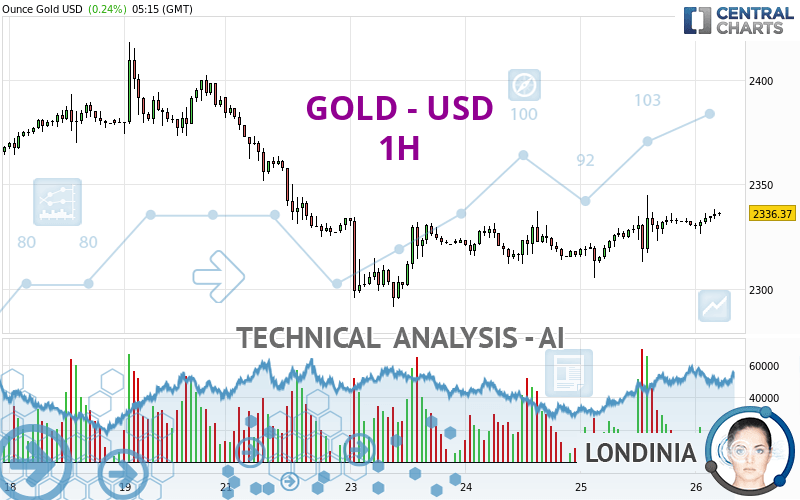
GOLD - USD - 1H - Technical analysis published on 04/26/2024 (GMT)
- 79
- 0
Click here for a new analysis!
- Timeframe : 1H
- - Analysis generated on
- Status : LEVEL MAINTAINED
Summary of the analysis

Additional analysis
Quotes
The GOLD - USD price is 2,336.37 USD. On the day, this instrument gained +0.25% with the lowest point at 2,326.29 USD and the highest point at 2,338.27 USD. The deviation from the price is +0.43% for the low point and -0.08% for the high point.The Central Gaps scanner detects a bullish opening marking the presence of buyers ahead of sellers at the opening but not sufficiently marked to allow the price to register a quotation gap.
Bullish opening
Type : Bullish
Timeframe : Openning
A study of price movements over other periods shows the following variations:
Near a new HIGH record (5 years)
Type : Bullish
Timeframe : Weekly
Near a new HIGH record (1 year)
Type : Bullish
Timeframe : Weekly
Near a new HIGH record (1st january)
Type : Bullish
Timeframe : Weekly
Near a new HIGH record (1 month)
Type : Bullish
Timeframe : Weekly
Technical
Technical analysis of this 1H chart of GOLD - USD indicates that the overall trend is bullish. 71.43% of the signals given by moving averages are bullish. This bullish trend is supported by the strong bullish signals given by short-term moving averages. There is no crossing of moving average by the price or crossing of moving averages between themselves.
In fact, 13 technical indicators on 18 studied are currently bullish. Caution: the Central Indicators scanner currently detects an excess:
CCI indicator is overbought : over 100
Type : Neutral
Timeframe : 1 hour
CCI indicator: bearish divergence
Type : Bearish
Timeframe : 1 hour
RSI indicator: bearish divergence
Type : Bearish
Timeframe : 1 hour
Williams %R indicator is overbought : over -20
Type : Neutral
Timeframe : 1 hour
Pivot points : price is under support 1
Type : Neutral
Timeframe : Weekly
The analysis of the price chart with Central Patterns scanners does not return any result.
Central Candlesticks, the scanner specialised in Japanese candlesticks, detects these signals that could have an impact on the current short-term trend:
Bearish harami
Type : Bearish
Timeframe : 1 hour
Doji
Type : Neutral
Timeframe : 1 hour
Bearish harami cross
Type : Bearish
Timeframe : 1 hour
| S3 | S2 | S1 | Price | R1 | R2 | R3 | |
|---|---|---|---|---|---|---|---|
| ProTrendLines | 2,291.48 | 2,312.53 | 2,324.62 | 2,336.37 | 2,336.78 | 2,373.14 | 2,398.33 |
| Change (%) | -1.92% | -1.02% | -0.50% | - | +0.02% | +1.57% | +2.65% |
| Change | -44.89 | -23.84 | -11.75 | - | +0.41 | +36.77 | +61.96 |
| Level | Intermediate | Major | Minor | - | Intermediate | Intermediate | Minor |
Attention could also be paid to pivot points to set price objectives:
| Pivot points | S3 | S2 | S1 | PP | R1 | R2 | R3 |
|---|---|---|---|---|---|---|---|
| Standard | 2,269.16 | 2,287.17 | 2,308.91 | 2,326.92 | 2,348.66 | 2,366.67 | 2,388.41 |
| Camarilla | 2,319.73 | 2,323.37 | 2,327.02 | 2,330.66 | 2,334.30 | 2,337.95 | 2,341.59 |
| Woodie | 2,271.04 | 2,288.10 | 2,310.79 | 2,327.85 | 2,350.54 | 2,367.60 | 2,390.29 |
| Fibonacci | 2,287.17 | 2,302.35 | 2,311.73 | 2,326.92 | 2,342.10 | 2,351.48 | 2,366.67 |
| Pivot points | S3 | S2 | S1 | PP | R1 | R2 | R3 |
|---|---|---|---|---|---|---|---|
| Standard | 2,245.34 | 2,285.41 | 2,337.77 | 2,377.84 | 2,430.20 | 2,470.27 | 2,522.63 |
| Camarilla | 2,364.71 | 2,373.19 | 2,381.66 | 2,390.13 | 2,398.60 | 2,407.08 | 2,415.55 |
| Woodie | 2,251.49 | 2,288.48 | 2,343.92 | 2,380.91 | 2,436.35 | 2,473.34 | 2,528.78 |
| Fibonacci | 2,285.41 | 2,320.72 | 2,342.53 | 2,377.84 | 2,413.15 | 2,434.96 | 2,470.27 |
| Pivot points | S3 | S2 | S1 | PP | R1 | R2 | R3 |
|---|---|---|---|---|---|---|---|
| Standard | 1,905.68 | 1,972.37 | 2,103.03 | 2,169.72 | 2,300.38 | 2,367.07 | 2,497.73 |
| Camarilla | 2,179.41 | 2,197.50 | 2,215.59 | 2,233.68 | 2,251.77 | 2,269.86 | 2,287.95 |
| Woodie | 1,937.66 | 1,988.36 | 2,135.01 | 2,185.71 | 2,332.36 | 2,383.06 | 2,529.71 |
| Fibonacci | 1,972.37 | 2,047.76 | 2,094.34 | 2,169.72 | 2,245.11 | 2,291.69 | 2,367.07 |
Numerical data
The following are the details of the technical indicators and moving averages that were collected to generate this technical analysis:
| RSI (14): | 60.82 | |
| MACD (12,26,9): | 2.9400 | |
| Directional Movement: | 9.23 | |
| AROON (14): | 85.72 | |
| DEMA (21): | 2,334.90 | |
| Parabolic SAR (0,02-0,02-0,2): | 2,341.84 | |
| Elder Ray (13): | 3.08 | |
| Super Trend (3,10): | 2,320.83 | |
| Zig ZAG (10): | 2,335.90 | |
| VORTEX (21): | 1.0700 | |
| Stochastique (14,3,5): | 76.72 | |
| TEMA (21): | 2,336.14 | |
| Williams %R (14): | -18.92 | |
| Chande Momentum Oscillator (20): | 3.47 | |
| Repulse (5,40,3): | 0.0600 | |
| ROCnROLL: | 1 | |
| TRIX (15,9): | 0.0200 | |
| Courbe Coppock: | 0.40 |
| MA7: | 2,344.26 | |
| MA20: | 2,336.67 | |
| MA50: | 2,206.20 | |
| MA100: | 2,118.83 | |
| MAexp7: | 2,334.05 | |
| MAexp20: | 2,331.12 | |
| MAexp50: | 2,328.38 | |
| MAexp100: | 2,333.54 | |
| Price / MA7: | -0.34% | |
| Price / MA20: | -0.01% | |
| Price / MA50: | +5.90% | |
| Price / MA100: | +10.27% | |
| Price / MAexp7: | +0.10% | |
| Price / MAexp20: | +0.23% | |
| Price / MAexp50: | +0.34% | |
| Price / MAexp100: | +0.12% |
News
The last news published on GOLD - USD at the time of the generation of this analysis was as follows:
-
 Gold Daily Forecast and Technical Analysis for April 25, 2024 by Bruce Powers, CMT, FX Empire
-
Navigating Gold Investment with Ion-Marc Valahu
-
Gold Daily Forecast and Technical Analysis for April 25 by Chris Lewis, #XAUUSD, #FXEmpire #gold
-
Gold Daily Forecast and Technical Analysis for April 25, 2024, by Chris Lewis for FX Empire
-
Gold Forecast April 26, 2024
About author

Online


Add a comment
Comments
0 comments on the analysis GOLD - USD - 1H