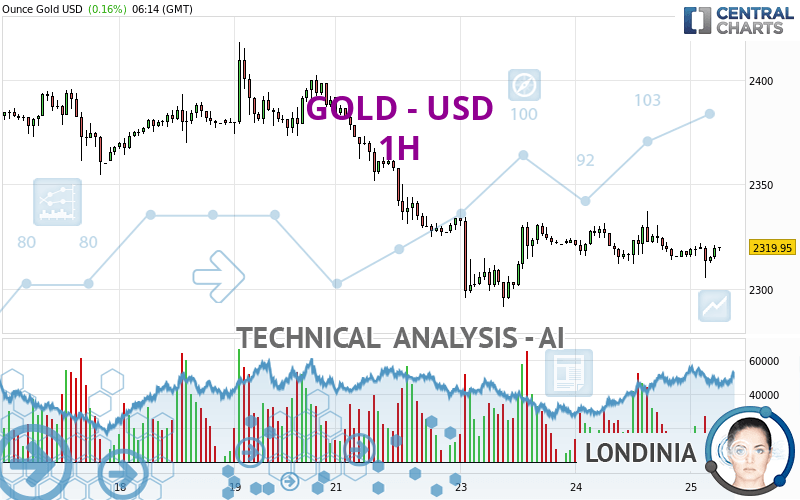
GOLD - USD - 1H - Technical analysis published on 04/25/2024 (GMT)
- 103
- 0
- Timeframe : 1H
- - Analysis generated on
- Status : NEUTRAL

Summary of the analysis

Additional analysis
Quotes
The GOLD - USD price is 2,319.95 USD. The price registered an increase of +0.16% on the session and was between 2,305.17 USD and 2,322.16 USD. This implies that the price is at +0.64% from its lowest and at -0.10% from its highest.The Central Gaps scanner detects a bearish opening marking the presence of sellers ahead of buyers at the opening but not sufficiently marked to allow the price to register a quotation gap.
Bearish opening
Type : Bearish
Timeframe : Openning
So that you have an overall view of the price change, here is a table showing the variations over several periods:
Near a new HIGH record (5 years)
Type : Bullish
Timeframe : Weekly
Near a new HIGH record (1 year)
Type : Bullish
Timeframe : Weekly
Near a new HIGH record (1st january)
Type : Bullish
Timeframe : Weekly
Near a new HIGH record (1 month)
Type : Bullish
Timeframe : Weekly
Technical
A technical analysis in 1H of this GOLD - USD chart shows a slightly bearish trend. 57.14% of the signals given by moving averages are bearish. Caution: the slightly bullish signals currently being given by short-term moving averages indicate that this overall trend could be reversed. An assessment of moving averages reveals several bearish and bullish signals:
Bullish trend reversal : Moving Average 20
Type : Bullish
Timeframe : 1 hour
Bullish trend reversal : adaptative moving average 20
Type : Bullish
Timeframe : 1 hour
Bearish price crossover with Moving Average 20
Type : Bearish
Timeframe : 1 hour
Bearish price crossover with Moving Average 50
Type : Bearish
Timeframe : 1 hour
The technical indicators are generally neutral. They do not provide relevant information on the direction of future price movements.
Central Indicators, the scanner specialised in technical indicators, has identified this signal:
Pivot points : price is under support 1
Type : Neutral
Timeframe : Weekly
Central Patterns, the scanner specializing in chart patterns, did not identify any signals.
Central Candlesticks, the scanner specialised in Japanese candlesticks, detects these bearish signals that could support the hypothesis of a small drop in the very short term:
Bearish harami
Type : Bearish
Timeframe : 1 hour
Bearish harami cross
Type : Bearish
Timeframe : 1 hour
| S3 | S2 | S1 | Price | R1 | R2 | R3 | |
|---|---|---|---|---|---|---|---|
| ProTrendLines | 2,203.99 | 2,291.48 | 2,311.81 | 2,319.95 | 2,324.42 | 2,373.14 | 2,398.33 |
| Change (%) | -5.00% | -1.23% | -0.35% | - | +0.19% | +2.29% | +3.38% |
| Change | -115.96 | -28.47 | -8.14 | - | +4.47 | +53.19 | +78.38 |
| Level | Intermediate | Minor | Intermediate | - | Intermediate | Intermediate | Minor |
Attention could also be paid to pivot points to set price objectives:
| Pivot points | S3 | S2 | S1 | PP | R1 | R2 | R3 |
|---|---|---|---|---|---|---|---|
| Standard | 2,280.76 | 2,296.29 | 2,306.30 | 2,321.83 | 2,331.84 | 2,347.37 | 2,357.38 |
| Camarilla | 2,309.30 | 2,311.64 | 2,313.98 | 2,316.32 | 2,318.66 | 2,321.00 | 2,323.34 |
| Woodie | 2,278.01 | 2,294.91 | 2,303.55 | 2,320.45 | 2,329.09 | 2,345.99 | 2,354.63 |
| Fibonacci | 2,296.29 | 2,306.04 | 2,312.07 | 2,321.83 | 2,331.58 | 2,337.61 | 2,347.37 |
| Pivot points | S3 | S2 | S1 | PP | R1 | R2 | R3 |
|---|---|---|---|---|---|---|---|
| Standard | 2,245.34 | 2,285.41 | 2,337.77 | 2,377.84 | 2,430.20 | 2,470.27 | 2,522.63 |
| Camarilla | 2,364.71 | 2,373.19 | 2,381.66 | 2,390.13 | 2,398.60 | 2,407.08 | 2,415.55 |
| Woodie | 2,251.49 | 2,288.48 | 2,343.92 | 2,380.91 | 2,436.35 | 2,473.34 | 2,528.78 |
| Fibonacci | 2,285.41 | 2,320.72 | 2,342.53 | 2,377.84 | 2,413.15 | 2,434.96 | 2,470.27 |
| Pivot points | S3 | S2 | S1 | PP | R1 | R2 | R3 |
|---|---|---|---|---|---|---|---|
| Standard | 1,905.68 | 1,972.37 | 2,103.03 | 2,169.72 | 2,300.38 | 2,367.07 | 2,497.73 |
| Camarilla | 2,179.41 | 2,197.50 | 2,215.59 | 2,233.68 | 2,251.77 | 2,269.86 | 2,287.95 |
| Woodie | 1,937.66 | 1,988.36 | 2,135.01 | 2,185.71 | 2,332.36 | 2,383.06 | 2,529.71 |
| Fibonacci | 1,972.37 | 2,047.76 | 2,094.34 | 2,169.72 | 2,245.11 | 2,291.69 | 2,367.07 |
Numerical data
The following is the status of the technical indicators and moving averages at the time of publication of this technical analysis:
| RSI (14): | 49.32 | |
| MACD (12,26,9): | -1.1900 | |
| Directional Movement: | -0.19 | |
| AROON (14): | -71.43 | |
| DEMA (21): | 2,317.36 | |
| Parabolic SAR (0,02-0,02-0,2): | 2,330.89 | |
| Elder Ray (13): | 0.65 | |
| Super Trend (3,10): | 2,308.63 | |
| Zig ZAG (10): | 2,318.52 | |
| VORTEX (21): | 1.0500 | |
| Stochastique (14,3,5): | 47.32 | |
| TEMA (21): | 2,317.69 | |
| Williams %R (14): | -46.40 | |
| Chande Momentum Oscillator (20): | -1.87 | |
| Repulse (5,40,3): | 0.1300 | |
| ROCnROLL: | -1 | |
| TRIX (15,9): | -0.0100 | |
| Courbe Coppock: | 0.42 |
| MA7: | 2,347.18 | |
| MA20: | 2,331.00 | |
| MA50: | 2,199.33 | |
| MA100: | 2,115.55 | |
| MAexp7: | 2,317.97 | |
| MAexp20: | 2,319.03 | |
| MAexp50: | 2,323.56 | |
| MAexp100: | 2,334.67 | |
| Price / MA7: | -1.16% | |
| Price / MA20: | -0.47% | |
| Price / MA50: | +5.48% | |
| Price / MA100: | +9.66% | |
| Price / MAexp7: | +0.09% | |
| Price / MAexp20: | +0.04% | |
| Price / MAexp50: | -0.16% | |
| Price / MAexp100: | -0.63% |
News
The latest news and videos published on GOLD - USD at the time of the analysis were as follows:
-
 Gold Daily Forecast and Technical Analysis for April 24, 2024 by Bruce Powers, CMT, FX Empire
-
Gold Daily Forecast and Technical Analysis for April 24 by Chris Lewis, #XAUUSD, #FXEmpire #gold
-
Caledonia Mining looks to the future after surge in price of Gold
-
Gold Daily Forecast and Technical Analysis for April 24, 2024, by Chris Lewis for FX Empire
-
Gold Daily Forecast and Technical Analysis for April 23, 2024 by Bruce Powers, CMT, FX Empire
About author

Online


Add a comment
Comments
0 comments on the analysis GOLD - USD - 1H