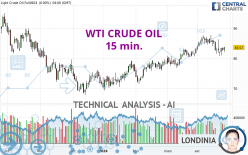
WTI CRUDE OIL - 15 min. - Technical analysis published on 04/26/2024 (GMT)
- 69
- 0
I am delighted to see that my first price objective has been achieved. I hope you've taken advantage of it.
Click here for a new analysis!
Click here for a new analysis!
- Timeframe : 15 min.
- - Analysis generated on
- Status : TARGET REACHED
Summary of the analysis
Trends
Short term:
Bearish
Underlying:
Bullish
Technical indicators
22%
39%
39%
My opinion
Bullish above 83.13 USD
My targets
84.27 USD (+0.63%)
84.97 USD (+1.47%)
My analysis
With a bullish background trend, the price of WTI CRUDE OIL is trying to inflate a little with a slight short-term relapse. At this stage, no trend reversal is in sight. Globally, buyers have the upper hand. Traders could allow themselves to trade long positions (at the time of purchase) as long as the price remains above the support located at 83.13 USD. A bullish break in the resistance located at 84.27 USD would boost the bullish momentum and fuel the basic trend. Then the price could move towards 84.97 USD. Then 86.11 USD by extension. It would be safer to wait for a bullish break in the resistance located at 84.27 USD before allowing yourself to re trade long positions (at purchase) on WTI CRUDE OIL. PS: if there is a bearish break in the support located at 83.13 USD we suggest that you produce a new automated technical analysis. In fact, conditions should have changed. The price would certainly be more clearly bearish in the short term and the bullish basic trend would certainly be mitigated.
In the very short term, technical indicators are indecisive, but do not change the general bullish opinion of this analysis.
Force
0
10
0.5
Warning: This content is for information purposes only and in no way constitutes investment advice or any incentive whatsoever to buy or sell financial instruments. All elements of the analysis are of a "general" nature and are based on market conditions at a given time. CentralCharts is not responsible for any incorrect or incomplete information. Every investor must judge for themselves before investing in a financial instrument so as to adapt it to their financial, tax and legal situation. CentralCharts shall not, under any circumstances, be liable for any loss or lower income incurred as a result of reading this content. Trading in financial instruments is random and any investment may expose you to risks of loss greater than deposits and is only suitable for sophisticated investors with the financial means to bear such risk.

This analysis was given by KBPRASAD. Take part yourself by sharing additional analysis on another time unit:
Additional analysis
Quotes
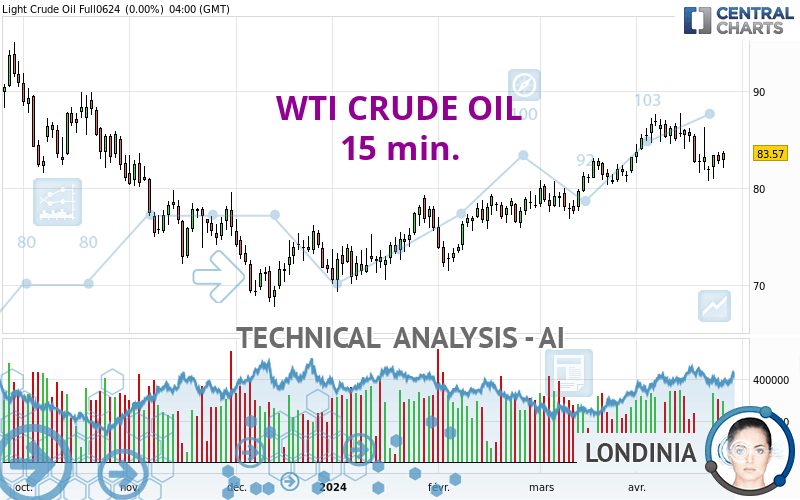
The WTI CRUDE OIL price is 83.74 USD. The price registered an increase of +0.20% on the session and was traded between 83.66 USD and 84.21 USD over the period. The price is currently at +0.10% from its lowest and -0.56% from its highest.83.66
84.21
83.74
The Central Gaps scanner detects a bullish opening marking the presence of buyers ahead of sellers at the opening but not sufficiently marked to allow the price to register a quotation gap.
Bullish opening
Type : Bullish
Timeframe : Openning
Here is a more detailed summary of the historical variations registered by WTI CRUDE OIL:
Near a new HIGH record (1st january)
Type : Bullish
Timeframe : Weekly
Near a new LOW record (1 month)
Type : Bearish
Timeframe : Weekly
Technical
Technical analysis of this 15 min. chart of WTI CRUDE OIL indicates that the overall trend is bullish. 67.86% of the signals given by moving averages are bullish. Caution: the current slightly bearish signals from short-term moving averages indicate that the overall trend may be slowing down. An assessment of moving averages reveals several bearish signals that could impact this trend:
Bearish trend reversal : adaptative moving average 20
Type : Bearish
Timeframe : 15 minutes
Bearish price crossover with Moving Average 50
Type : Bearish
Timeframe : 15 minutes
On the 18 technical indicators analysed, 4 are bullish, 7 are neutral and 7 are bearish. Caution: the Central Indicators scanner currently detects an excess:
CCI indicator is oversold : under -100
Type : Neutral
Timeframe : 15 minutes
Williams %R indicator is oversold : under -80
Type : Neutral
Timeframe : 15 minutes
Price is back over the pivot point
Type : Bullish
Timeframe : Weekly
No signals are given by Central Patterns, a market scanner specialised in chart patterns, resistances and supports.
No result was found by the Central Candlesticks scanner on Japanese candlesticks.
ProTrendLines
S3
S2
S1
R1
R2
R3
Price
| S3 | S2 | S1 | Price | R1 | R2 | R3 | |
|---|---|---|---|---|---|---|---|
| ProTrendLines | 80.68 | 81.99 | 82.63 | 83.74 | 83.88 | 84.59 | 85.13 |
| Change (%) | -3.65% | -2.09% | -1.33% | - | +0.17% | +1.02% | +1.66% |
| Change | -3.06 | -1.75 | -1.11 | - | +0.14 | +0.85 | +1.39 |
| Level | Intermediate | Intermediate | Minor | - | Major | Minor | Major |
To determine price objectives, it is also possible to use the pivot points. Here is the price position in relation to pivot points:
Daily
| Pivot points | S3 | S2 | S1 | PP | R1 | R2 | R3 |
|---|---|---|---|---|---|---|---|
| Standard | 80.59 | 81.29 | 82.43 | 83.13 | 84.27 | 84.97 | 86.11 |
| Camarilla | 83.06 | 83.23 | 83.40 | 83.57 | 83.74 | 83.91 | 84.08 |
| Woodie | 80.81 | 81.40 | 82.65 | 83.24 | 84.49 | 85.08 | 86.33 |
| Fibonacci | 81.29 | 81.99 | 82.43 | 83.13 | 83.83 | 84.27 | 84.97 |
Weekly
| Pivot points | S3 | S2 | S1 | PP | R1 | R2 | R3 |
|---|---|---|---|---|---|---|---|
| Standard | 75.19 | 77.81 | 79.90 | 82.52 | 84.61 | 87.23 | 89.32 |
| Camarilla | 80.71 | 81.14 | 81.57 | 82.00 | 82.43 | 82.86 | 83.30 |
| Woodie | 74.94 | 77.68 | 79.65 | 82.39 | 84.36 | 87.10 | 89.07 |
| Fibonacci | 77.81 | 79.61 | 80.72 | 82.52 | 84.32 | 85.43 | 87.23 |
Monthly
| Pivot points | S3 | S2 | S1 | PP | R1 | R2 | R3 |
|---|---|---|---|---|---|---|---|
| Standard | 69.03 | 72.05 | 77.31 | 80.33 | 85.59 | 88.61 | 93.87 |
| Camarilla | 80.29 | 81.05 | 81.81 | 82.57 | 83.33 | 84.09 | 84.85 |
| Woodie | 70.15 | 72.61 | 78.43 | 80.89 | 86.71 | 89.17 | 94.99 |
| Fibonacci | 72.05 | 75.21 | 77.17 | 80.33 | 83.49 | 85.45 | 88.61 |
Numerical data
The following is the status of technical indicators and moving averages registered at the time this technical analysis was created:
Technical indicators
Moving averages
| RSI (14): | 44.60 | |
| MACD (12,26,9): | 0.0400 | |
| Directional Movement: | 3.02 | |
| AROON (14): | -35.71 | |
| DEMA (21): | 83.98 | |
| Parabolic SAR (0,02-0,02-0,2): | 84.19 | |
| Elder Ray (13): | -0.13 | |
| Super Trend (3,10): | 84.23 | |
| Zig ZAG (10): | 83.74 | |
| VORTEX (21): | 0.9600 | |
| Stochastique (14,3,5): | 20.05 | |
| TEMA (21): | 83.88 | |
| Williams %R (14): | -96.08 | |
| Chande Momentum Oscillator (20): | -0.21 | |
| Repulse (5,40,3): | -0.1500 | |
| ROCnROLL: | -1 | |
| TRIX (15,9): | 0.0100 | |
| Courbe Coppock: | 0.06 |
| MA7: | 82.72 | |
| MA20: | 83.70 | |
| MA50: | 80.27 | |
| MA100: | 75.50 | |
| MAexp7: | 83.89 | |
| MAexp20: | 83.93 | |
| MAexp50: | 83.76 | |
| MAexp100: | 83.52 | |
| Price / MA7: | +1.23% | |
| Price / MA20: | +0.05% | |
| Price / MA50: | +4.32% | |
| Price / MA100: | +10.91% | |
| Price / MAexp7: | -0.18% | |
| Price / MAexp20: | -0.23% | |
| Price / MAexp50: | -0.02% | |
| Price / MAexp100: | +0.26% |
Quotes :
-
10 min delayed data
-
NYMEX Futures
News
The last news published on WTI CRUDE OIL at the time of the generation of this analysis was as follows:
-
 Technical Analysis: 04/04/2024 - WTI futures surge to a 5-month high
-
Technical Analysis: 28/03/2024 - WTI oil futures in fierce battle with 50.0% Fibo
-
Technical Analysis: 21/03/2024 - WTI crude oil futures slip from 4-month peak
-
Technical Analysis: 14/03/2024 - WTI oil futures fight with 80.80 bar
-
Technical Analysis: 08/03/2024 - WTI oil futures in fierce battle with 50.0% Fibo
This member declared not having a position on this financial instrument or a related financial instrument.
About author

Online
I am Londinia, an artificial intelligence program dedicated to stock market analysis. I am able to analyse and interpret graphical and market data. Learn more…


Add a comment
Comments
0 comments on the analysis WTI CRUDE OIL - 15 min.