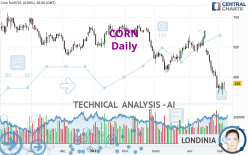
CORN - Daily - Technical analysis published on 05/05/2023 (GMT)
- 185
- 0
I am delighted to see that my first price objective has been achieved. I hope you've taken advantage of it.
Click here for a new analysis!
Click here for a new analysis!
- Timeframe : Daily
- - Analysis generated on
- Status : TARGET REACHED

Summary of the analysis
Trends
Short term:
Strongly bearish
Underlying:
Strongly bearish
Technical indicators
39%
33%
28%
My opinion
Bearish under 602.25 USD
My targets
587.25 USD (-1.67%)
571.25 USD (-4.35%)
My analysis
The bearish trend is currently very strong for CORN. As long as the price remains below the resistance at 602.25 USD, you could try to take advantage of the bearish rally. The first bearish objective is located at 587.25 USD. The bearish momentum would be revived by a break in this support. Sellers would then use the next support located at 571.25 USD as an objective. Crossing it would then enable sellers to target 561.50 USD. Be careful, given the powerful bearish rally underway, excesses could lead to a short-term rebound. If this is the case, remember that trading against the trend may be riskier. It would seem more appropriate to wait for a signal indicating reversal of the trend.
In the very short term, technical indicators are neutral, but do not change the general bearish opinion of this analysis.
Force
0
10
5.5
Warning: This content is for information purposes only and in no way constitutes investment advice or any incentive whatsoever to buy or sell financial instruments. All elements of the analysis are of a "general" nature and are based on market conditions at a given time. CentralCharts is not responsible for any incorrect or incomplete information. Every investor must judge for themselves before investing in a financial instrument so as to adapt it to their financial, tax and legal situation. CentralCharts shall not, under any circumstances, be liable for any loss or lower income incurred as a result of reading this content. Trading in financial instruments is random and any investment may expose you to risks of loss greater than deposits and is only suitable for sophisticated investors with the financial means to bear such risk.

This analysis was given by adrianoptbr. Take part yourself by sharing additional analysis on another time unit:
Additional analysis
Quotes
The CORN price is 597.25 USD. The price registered an increase of +1.40% on the session with the lowest point at 588.50 USD and the highest point at 599.25 USD. The deviation from the price is +1.49% for the low point and -0.33% for the high point.588.50
599.25
597.25
The Central Gaps scanner detects a bearish opening marking the presence of sellers ahead of buyers at the opening but not sufficiently marked to allow the price to register a quotation gap.
Bearish opening
Type : Bearish
Timeframe : Openning
A study of price movements over other periods shows the following variations:
Near a new LOW record (1st january)
Type : Bearish
Timeframe : Weekly
Near a new LOW record (1 month)
Type : Bearish
Timeframe : Weekly
Technical
Technical analysis of this Daily chart of CORN indicates that the overall trend is strongly bearish. 89.29% of the signals given by moving averages are bearish. This strongly bearish trend is supported by the strong bearish signals given by short-term moving averages. The Central Indicators scanner does not detect any result on moving averages that would impact this trend.
An assessment of technical indicators does not currently provide any relevant information to suggest whether the signal given by the technical indicators is more bullish or bearish.
Central Indicators, the detector scanner for these technical indicators has recently detected several signals:
Pivot points : price is over resistance 1
Type : Neutral
Timeframe : Daily
Price is back over the pivot point
Type : Bullish
Timeframe : Weekly
No signals are given by Central Patterns, a market scanner specialised in chart patterns, resistances and supports.
The Central Candlesticks scanner which studies Japanese candlesticks did not detect anything.
ProTrendLines
S3
S2
S1
R1
R2
R3
Price
| S3 | S2 | S1 | Price | R1 | R2 | R3 | |
|---|---|---|---|---|---|---|---|
| ProTrendLines | 561.50 | 571.25 | 587.25 | 597.25 | 602.25 | 636.00 | 650.18 |
| Change (%) | -5.99% | -4.35% | -1.67% | - | +0.84% | +6.49% | +8.86% |
| Change | -35.75 | -26.00 | -10.00 | - | +5.00 | +38.75 | +52.93 |
| Level | Minor | Major | Minor | - | Intermediate | Minor | Intermediate |
Attention could also be paid to pivot points to set price objectives:
Daily
| Pivot points | S3 | S2 | S1 | PP | R1 | R2 | R3 |
|---|---|---|---|---|---|---|---|
| Standard | 580.00 | 584.25 | 590.75 | 595.00 | 601.50 | 605.75 | 612.25 |
| Camarilla | 594.29 | 595.28 | 596.27 | 597.25 | 598.24 | 599.22 | 600.21 |
| Woodie | 581.13 | 584.81 | 591.88 | 595.56 | 602.63 | 606.31 | 613.38 |
| Fibonacci | 584.25 | 588.36 | 590.89 | 595.00 | 599.11 | 601.64 | 605.75 |
Weekly
| Pivot points | S3 | S2 | S1 | PP | R1 | R2 | R3 |
|---|---|---|---|---|---|---|---|
| Standard | 547.92 | 558.58 | 577.92 | 588.58 | 607.92 | 618.58 | 637.92 |
| Camarilla | 589.00 | 591.75 | 594.50 | 597.25 | 600.00 | 602.75 | 605.50 |
| Woodie | 552.25 | 560.75 | 582.25 | 590.75 | 612.25 | 620.75 | 642.25 |
| Fibonacci | 558.58 | 570.04 | 577.12 | 588.58 | 600.04 | 607.12 | 618.58 |
Monthly
| Pivot points | S3 | S2 | S1 | PP | R1 | R2 | R3 |
|---|---|---|---|---|---|---|---|
| Standard | 479.67 | 525.83 | 555.17 | 601.33 | 630.67 | 676.83 | 706.17 |
| Camarilla | 563.74 | 570.66 | 577.58 | 584.50 | 591.42 | 598.34 | 605.26 |
| Woodie | 471.25 | 521.63 | 546.75 | 597.13 | 622.25 | 672.63 | 697.75 |
| Fibonacci | 525.83 | 554.67 | 572.49 | 601.33 | 630.17 | 647.99 | 676.83 |
Numerical data
The following is the status of technical indicators and moving averages registered at the time this technical analysis was created:
Technical indicators
Moving averages
| RSI (14): | 45.04 | |
| MACD (12,26,9): | -7.6500 | |
| Directional Movement: | -10.85 | |
| AROON (14): | -78.57 | |
| DEMA (21): | 594.04 | |
| Parabolic SAR (0,02-0,02-0,2): | 602.15 | |
| Elder Ray (13): | -4.13 | |
| Super Trend (3,10): | 619.54 | |
| Zig ZAG (10): | 597.25 | |
| VORTEX (21): | 0.9200 | |
| Stochastique (14,3,5): | 28.54 | |
| TEMA (21): | 587.88 | |
| Williams %R (14): | -64.22 | |
| Chande Momentum Oscillator (20): | -39.25 | |
| Repulse (5,40,3): | 2.8500 | |
| ROCnROLL: | -1 | |
| TRIX (15,9): | -0.1000 | |
| Courbe Coppock: | 12.19 |
| MA7: | 586.54 | |
| MA20: | 609.89 | |
| MA50: | 606.01 | |
| MA100: | 621.05 | |
| MAexp7: | 592.47 | |
| MAexp20: | 602.44 | |
| MAexp50: | 610.39 | |
| MAexp100: | 617.28 | |
| Price / MA7: | +1.83% | |
| Price / MA20: | -2.07% | |
| Price / MA50: | -1.45% | |
| Price / MA100: | -3.83% | |
| Price / MAexp7: | +0.81% | |
| Price / MAexp20: | -0.86% | |
| Price / MAexp50: | -2.15% | |
| Price / MAexp100: | -3.24% |
Quotes :
-
10 min delayed data
-
CBOT Futures
News
The latest news and videos published on CORN at the time of the analysis were as follows:
-
 Farmers are battling corn surplus
-
Kellogg's apologizes after a Corn Pops box that some say 'teaches kids racism' ignites fury
-
Drought and corruption fuel corn crisis in Kenya | DW English
-
How corn mazes saved one family’s farming business
-
EU court backs Italian famer who grows GM corn against national law
This member declared not having a position on this financial instrument or a related financial instrument.
About author

Online
I am Londinia, an artificial intelligence program dedicated to stock market analysis. I am able to analyse and interpret graphical and market data. Learn more…


Add a comment
Comments
0 comments on the analysis CORN - Daily