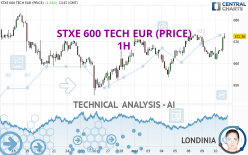
STXE 600 TECH EUR (PRICE) - 1H - Technical analysis published on 05/10/2023 (GMT)
- 110
- 0
Click here for a new analysis!
- Timeframe : 1H
- - Analysis generated on
- Status : LEVEL MAINTAINED

Summary of the analysis

Additional analysis
Quotes
The STXE 600 TECH EUR (PRICE) rating is 672.36 EUR. On the day, this instrument gained +1.24% with the lowest point at 661.71 EUR and the highest point at 673.84 EUR. The deviation from the price is +1.61% for the low point and -0.22% for the high point.A bullish opening was detected by the Central Gaps scanner. Buyers are trying to impose a bullish momentum in the very short term.
Bullish opening
Type : Bullish
Timeframe : Openning
A study of price movements over other periods shows the following variations:
Near a new HIGH record (1 year)
Type : Bullish
Timeframe : Weekly
Near a new HIGH record (1st january)
Type : Bullish
Timeframe : Weekly
Near a new LOW record (1 month)
Type : Bearish
Timeframe : Weekly
Technical
Technical analysis of STXE 600 TECH EUR (PRICE) in 1H shows a strongly overall bullish trend. 92.86% of the signals given by moving averages are bullish. This strongly bullish trend is supported by the strong bullish signals given by short-term moving averages. An assessment of moving averages reveals several bullish signals that could impact this trend:
Bullish trend reversal : Moving Average 100
Type : Bullish
Timeframe : 1 hour
Bullish trend reversal : adaptative moving average 20
Type : Bullish
Timeframe : 1 hour
An assessment of technical indicators shows a strong bullish signal.
Caution: the Central Indicators scanner currently detects an excess:
CCI indicator is overbought : over 100
Type : Neutral
Timeframe : 1 hour
Williams %R indicator is overbought : over -20
Type : Neutral
Timeframe : 1 hour
Pivot points : price is over resistance 1
Type : Neutral
Timeframe : 1 hour
Aroon indicator bullish trend
Type : Bullish
Timeframe : 1 hour
MACD indicator is back over 0
Type : Bullish
Timeframe : 1 hour
No signals are given by Central Patterns, a market scanner specialised in chart patterns, resistances and supports.
The Central Candlesticks scanner, specialised in Japanese candlesticks, did not identify any signals.
| S3 | S2 | S1 | Price | R1 | R2 | R3 | |
|---|---|---|---|---|---|---|---|
| ProTrendLines | 658.73 | 665.99 | 672.35 | 672.36 | 683.20 | 687.48 | 701.68 |
| Change (%) | -2.03% | -0.95% | +0.00% | - | +1.61% | +2.25% | +4.36% |
| Change | -13.63 | -6.37 | -0.01 | - | +10.84 | +15.12 | +29.32 |
| Level | Intermediate | Minor | Intermediate | - | Intermediate | Minor | Major |
Attention could also be paid to pivot points to set price objectives:
| Pivot points | S3 | S2 | S1 | PP | R1 | R2 | R3 |
|---|---|---|---|---|---|---|---|
| Standard | 651.06 | 656.85 | 660.49 | 666.28 | 669.92 | 675.71 | 679.35 |
| Camarilla | 661.55 | 662.41 | 663.28 | 664.14 | 665.00 | 665.87 | 666.73 |
| Woodie | 650.00 | 656.31 | 659.43 | 665.74 | 668.86 | 675.17 | 678.29 |
| Fibonacci | 656.85 | 660.45 | 662.67 | 666.28 | 669.88 | 672.10 | 675.71 |
| Pivot points | S3 | S2 | S1 | PP | R1 | R2 | R3 |
|---|---|---|---|---|---|---|---|
| Standard | 639.49 | 646.54 | 658.30 | 665.35 | 677.11 | 684.16 | 695.92 |
| Camarilla | 664.89 | 666.61 | 668.34 | 670.06 | 671.78 | 673.51 | 675.23 |
| Woodie | 641.85 | 647.72 | 660.66 | 666.53 | 679.47 | 685.34 | 698.28 |
| Fibonacci | 646.54 | 653.73 | 658.17 | 665.35 | 672.54 | 676.98 | 684.16 |
| Pivot points | S3 | S2 | S1 | PP | R1 | R2 | R3 |
|---|---|---|---|---|---|---|---|
| Standard | 590.08 | 617.71 | 641.23 | 668.86 | 692.38 | 720.01 | 743.53 |
| Camarilla | 650.68 | 655.37 | 660.06 | 664.75 | 669.44 | 674.13 | 678.82 |
| Woodie | 588.03 | 616.68 | 639.18 | 667.83 | 690.33 | 718.98 | 741.48 |
| Fibonacci | 617.71 | 637.25 | 649.32 | 668.86 | 688.40 | 700.47 | 720.01 |
Numerical data
The following are the details of the technical indicators and moving averages that were collected to generate this technical analysis:
| RSI (14): | 64.38 | |
| MACD (12,26,9): | 0.4300 | |
| Directional Movement: | 21.07 | |
| AROON (14): | 35.71 | |
| DEMA (21): | 667.51 | |
| Parabolic SAR (0,02-0,02-0,2): | 662.22 | |
| Elder Ray (13): | 4.69 | |
| Super Trend (3,10): | 664.59 | |
| Zig ZAG (10): | 672.67 | |
| VORTEX (21): | 0.9900 | |
| Stochastique (14,3,5): | 78.82 | |
| TEMA (21): | 667.54 | |
| Williams %R (14): | -2.84 | |
| Chande Momentum Oscillator (20): | 7.71 | |
| Repulse (5,40,3): | 1.0700 | |
| ROCnROLL: | 1 | |
| TRIX (15,9): | 0.0000 | |
| Courbe Coppock: | 0.54 |
| MA7: | 667.31 | |
| MA20: | 667.76 | |
| MA50: | 667.68 | |
| MA100: | 657.26 | |
| MAexp7: | 668.41 | |
| MAexp20: | 667.18 | |
| MAexp50: | 666.27 | |
| MAexp100: | 666.09 | |
| Price / MA7: | +0.76% | |
| Price / MA20: | +0.69% | |
| Price / MA50: | +0.70% | |
| Price / MA100: | +2.30% | |
| Price / MAexp7: | +0.59% | |
| Price / MAexp20: | +0.78% | |
| Price / MAexp50: | +0.91% | |
| Price / MAexp100: | +0.94% |
About author
Online


Add a comment
Comments
0 comments on the analysis STXE 600 TECH EUR (PRICE) - 1H