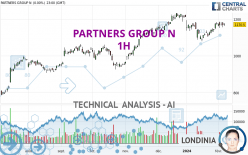
PARTNERS GROUP N - 1H - Technical analysis published on 02/08/2024 (GMT)
- 86
- 0
Click here for a new analysis!
- Timeframe : 1H
- - Analysis generated on
- Status : LEVEL MAINTAINED

Summary of the analysis

Additional analysis
Quotes
The PARTNERS GROUP N rating is 1,192.0 CHF. On the day, this instrument gained +1.84% with the lowest point at 1,174.5 CHF and the highest point at 1,193.0 CHF. The deviation from the price is +1.49% for the low point and -0.08% for the high point.The Central Gaps scanner detects a bullish opening. A small advantage for buyers in the very short term.
Bullish opening
Type : Bullish
Timeframe : Openning
So that you have an overall view of the price change, here is a table showing the variations over several periods:
Near a new HIGH record (1 year)
Type : Bullish
Timeframe : Weekly
New HIGH record (1st january)
Type : Bullish
Timeframe : Weekly
Near a new HIGH record (1st january)
Type : Bullish
Timeframe : Weekly
New HIGH record (1 month)
Type : Bullish
Timeframe : Weekly
Technical
A technical analysis in 1H of this PARTNERS GROUP N chart shows a strongly bullish trend. The signals given by the moving averages are 89.29% bullish. This strong bullish trend is confirmed by the strong signals currently being given by short-term moving averages. The Central Indicators scanner does not detect any result on moving averages that would impact this trend.
Technical indicators are strongly bullish, suggesting that the price increase should continue.
Caution: the Central Indicators scanner currently detects an excess:
CCI indicator is overbought : over 100
Type : Neutral
Timeframe : 1 hour
Previous candle closed over Bollinger bands
Type : Neutral
Timeframe : 1 hour
Williams %R indicator is overbought : over -20
Type : Neutral
Timeframe : 1 hour
Pivot points : price is over resistance 1
Type : Neutral
Timeframe : Weekly
Pivot points : price is over resistance 3
Type : Neutral
Timeframe : 1 hour
An analysis of the price chart with the Central Patterns scanner (detector of chart patterns and resistances and supports) shows several results that can have an impact on the price change:
Near horizontal resistance
Type : Bearish
Timeframe : 1 hour
Resistance of channel is broken
Type : Bullish
Timeframe : 1 hour
Central Candlesticks, the scanner specialised in Japanese candlesticks, detects this inversion signal that could impact the current short-term trend:
Doji
Type : Neutral
Timeframe : 1 hour
| S3 | S2 | S1 | Price | R1 | R2 | R3 | |
|---|---|---|---|---|---|---|---|
| ProTrendLines | 1,159.5 | 1,175.5 | 1,185.8 | 1,192.0 | 1,230.8 | 1,398.0 | 1,655.0 |
| Change (%) | -2.73% | -1.38% | -0.52% | - | +3.26% | +17.28% | +38.84% |
| Change | -32.5 | -16.5 | -6.2 | - | +38.8 | +206.0 | +463.0 |
| Level | Intermediate | Intermediate | Intermediate | - | Intermediate | Minor | Major |
Pivot points can also be used to set your price objectives. Here is the price situation in relation to pivot points:
| Pivot points | S3 | S2 | S1 | PP | R1 | R2 | R3 |
|---|---|---|---|---|---|---|---|
| Standard | 1,149.8 | 1,156.2 | 1,163.3 | 1,169.7 | 1,176.8 | 1,183.2 | 1,190.3 |
| Camarilla | 1,166.8 | 1,168.0 | 1,169.3 | 1,170.5 | 1,171.7 | 1,173.0 | 1,174.2 |
| Woodie | 1,150.3 | 1,156.4 | 1,163.8 | 1,169.9 | 1,177.3 | 1,183.4 | 1,190.8 |
| Fibonacci | 1,156.2 | 1,161.3 | 1,164.5 | 1,169.7 | 1,174.8 | 1,178.0 | 1,183.2 |
| Pivot points | S3 | S2 | S1 | PP | R1 | R2 | R3 |
|---|---|---|---|---|---|---|---|
| Standard | 1,081.3 | 1,106.2 | 1,136.8 | 1,161.7 | 1,192.3 | 1,217.2 | 1,247.8 |
| Camarilla | 1,152.2 | 1,157.3 | 1,162.4 | 1,167.5 | 1,172.6 | 1,177.7 | 1,182.8 |
| Woodie | 1,084.3 | 1,107.6 | 1,139.8 | 1,163.1 | 1,195.3 | 1,218.6 | 1,250.8 |
| Fibonacci | 1,106.2 | 1,127.4 | 1,140.5 | 1,161.7 | 1,182.9 | 1,196.0 | 1,217.2 |
| Pivot points | S3 | S2 | S1 | PP | R1 | R2 | R3 |
|---|---|---|---|---|---|---|---|
| Standard | 989.5 | 1,035.0 | 1,104.0 | 1,149.5 | 1,218.5 | 1,264.0 | 1,333.0 |
| Camarilla | 1,141.5 | 1,152.0 | 1,162.5 | 1,173.0 | 1,183.5 | 1,194.0 | 1,204.5 |
| Woodie | 1,001.3 | 1,040.9 | 1,115.8 | 1,155.4 | 1,230.3 | 1,269.9 | 1,344.8 |
| Fibonacci | 1,035.0 | 1,078.7 | 1,105.8 | 1,149.5 | 1,193.2 | 1,220.3 | 1,264.0 |
Numerical data
The following are the details of the technical indicators and moving averages that were collected to generate this technical analysis:
| RSI (14): | 67.20 | |
| MACD (12,26,9): | 4.9000 | |
| Directional Movement: | 29.8 | |
| AROON (14): | 78.6 | |
| DEMA (21): | 1,181.1 | |
| Parabolic SAR (0,02-0,02-0,2): | 1,163.5 | |
| Elder Ray (13): | 13.0 | |
| Super Trend (3,10): | 1,172.1 | |
| Zig ZAG (10): | 1,192.0 | |
| VORTEX (21): | 1.2000 | |
| Stochastique (14,3,5): | 98.90 | |
| TEMA (21): | 1,185.4 | |
| Williams %R (14): | -3.30 | |
| Chande Momentum Oscillator (20): | 26.5 | |
| Repulse (5,40,3): | 0.8000 | |
| ROCnROLL: | 1 | |
| TRIX (15,9): | 0.0000 | |
| Courbe Coppock: | 3.00 |
| MA7: | 1,173.2 | |
| MA20: | 1,143.4 | |
| MA50: | 1,163.8 | |
| MA100: | 1,096.5 | |
| MAexp7: | 1,184.4 | |
| MAexp20: | 1,176.3 | |
| MAexp50: | 1,170.8 | |
| MAexp100: | 1,162.6 | |
| Price / MA7: | +1.60% | |
| Price / MA20: | +4.25% | |
| Price / MA50: | +2.42% | |
| Price / MA100: | +8.71% | |
| Price / MAexp7: | +0.64% | |
| Price / MAexp20: | +1.33% | |
| Price / MAexp50: | +1.81% | |
| Price / MAexp100: | +2.53% |
News
Don't forget to follow the news on PARTNERS GROUP N. At the time of publication of this analysis, the latest news was as follows:
- Partners Group further strengthens its Real Estate business with three leadership appointments
- Partners Group reports AuM of USD 147 billion per end of 2023; increases guidance for gross client demand in 2024
- Partners Group to acquire Velvet CARE, one of the leading European manufacturers of hygiene paper products
- Partners Group announces updates to its Executive Team
- Partners Group to sell Civica, a global provider of cloud software solutions for the public sector
About author
Online


Add a comment
Comments
0 comments on the analysis PARTNERS GROUP N - 1H