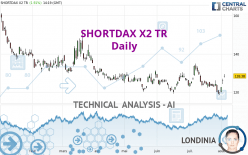
SHORTDAX X2 TR - Daily - Technical analysis published on 08/03/2023 (GMT)
- 103
- 0
- Timeframe : Daily
- - Analysis generated on
- Status : NEUTRAL

Summary of the analysis

Additional analysis
Quotes
The SHORTDAX X2 TR rating is 128.38 EUR. On the day, this instrument gained +1.91% and was traded between 127.58 EUR and 129.35 EUR over the period. The price is currently at +0.63% from its lowest and -0.75% from its highest.A bullish gap was detected at the opening by the Central Gaps scanner. There are a lot of buyers and they have the upper hand in the very short term.
Opening Gap UP
Type : Bullish
Timeframe : Openning
So that you have an overall view of the price change, here is a table showing the variations over several periods:
New LOW record (5 years)
Type : Bearish
Timeframe : Weekly
Near a new HIGH record (1 month)
Type : Bullish
Timeframe : Weekly
Technical
A technical analysis in Daily of this SHORTDAX X2 TR chart shows a slightly bearish trend. 57.14% of the signals given by moving averages are bearish. Caution: the slightly bullish signals currently being given by short-term moving averages indicate that this overall trend could be reversed. The Central Indicators market scanner is currently detecting several bullish signals that could impact this trend:
Bullish trend reversal : adaptative moving average 20
Type : Bullish
Timeframe : Daily
Bullish trend reversal : adaptative moving average 50
Type : Bullish
Timeframe : Daily
Bullish price crossover with Moving Average 100
Type : Bullish
Timeframe : Daily
Bullish price crossover with adaptative moving average 20
Type : Bullish
Timeframe : Daily
Bullish price crossover with adaptative moving average 100
Type : Bullish
Timeframe : Daily
The probability of a further increase are moderate given the direction of the technical indicators.
Caution: the Central Indicators scanner currently detects an excess:
Williams %R indicator is overbought : over -20
Type : Neutral
Timeframe : Daily
Pivot points : price is over resistance 1
Type : Neutral
Timeframe : Daily
Pivot points : price is over resistance 1
Type : Neutral
Timeframe : Weekly
MACD crosses UP its Moving Average
Type : Bullish
Timeframe : Daily
SuperTrend indicator bullish reversal
Type : Bullish
Timeframe : Daily
Central Patterns, the scanner specializing in chart patterns, did not identify any signals.
From the Japanese candlestick perspective, the Central Candlesticks scanner notes the presence of these results that could impact the short-term trend:
Upside gap
Type : Bullish
Timeframe : Daily
Doji
Type : Neutral
Timeframe : Daily
| S1 | Price | R1 | R2 | R3 | |
|---|---|---|---|---|---|
| ProTrendLines | 120.47 | 128.38 | 130.68 | 151.79 | 170.85 |
| Change (%) | -6.16% | - | +1.79% | +18.23% | +33.08% |
| Change | -7.91 | - | +2.30 | +23.41 | +42.47 |
| Level | Major | - | Major | Intermediate | Intermediate |
Attention could also be paid to pivot points to set price objectives:
| Pivot points | S3 | S2 | S1 | PP | R1 | R2 | R3 |
|---|---|---|---|---|---|---|---|
| Standard | 121.64 | 122.90 | 124.44 | 125.70 | 127.24 | 128.50 | 130.04 |
| Camarilla | 125.21 | 125.47 | 125.72 | 125.98 | 126.24 | 126.49 | 126.75 |
| Woodie | 121.78 | 122.97 | 124.58 | 125.77 | 127.38 | 128.57 | 130.18 |
| Fibonacci | 122.90 | 123.97 | 124.63 | 125.70 | 126.77 | 127.43 | 128.50 |
| Pivot points | S3 | S2 | S1 | PP | R1 | R2 | R3 |
|---|---|---|---|---|---|---|---|
| Standard | 109.21 | 114.03 | 116.60 | 121.42 | 123.99 | 128.81 | 131.38 |
| Camarilla | 117.13 | 117.81 | 118.48 | 119.16 | 119.84 | 120.52 | 121.19 |
| Woodie | 108.08 | 113.47 | 115.47 | 120.86 | 122.86 | 128.25 | 130.25 |
| Fibonacci | 114.03 | 116.86 | 118.60 | 121.42 | 124.25 | 125.99 | 128.81 |
| Pivot points | S3 | S2 | S1 | PP | R1 | R2 | R3 |
|---|---|---|---|---|---|---|---|
| Standard | 97.25 | 107.82 | 113.71 | 124.28 | 130.17 | 140.74 | 146.63 |
| Camarilla | 115.06 | 116.57 | 118.08 | 119.59 | 121.10 | 122.61 | 124.12 |
| Woodie | 94.90 | 106.65 | 111.36 | 123.11 | 127.82 | 139.57 | 144.28 |
| Fibonacci | 107.82 | 114.11 | 118.00 | 124.28 | 130.57 | 134.46 | 140.74 |
Numerical data
The following are the details of the technical indicators and moving averages that were collected to generate this technical analysis:
| RSI (14): | 58.63 | |
| MACD (12,26,9): | -0.5600 | |
| Directional Movement: | 15.18 | |
| AROON (14): | 21.43 | |
| DEMA (21): | 123.38 | |
| Parabolic SAR (0,02-0,02-0,2): | 118.57 | |
| Elder Ray (13): | 4.55 | |
| Super Trend (3,10): | 120.26 | |
| Zig ZAG (10): | 128.28 | |
| VORTEX (21): | 0.9300 | |
| Stochastique (14,3,5): | 77.45 | |
| TEMA (21): | 123.25 | |
| Williams %R (14): | -9.86 | |
| Chande Momentum Oscillator (20): | 4.17 | |
| Repulse (5,40,3): | 0.4300 | |
| ROCnROLL: | 1 | |
| TRIX (15,9): | -0.1000 | |
| Courbe Coppock: | 4.78 |
| MA7: | 122.84 | |
| MA20: | 124.62 | |
| MA50: | 125.25 | |
| MA100: | 127.87 | |
| MAexp7: | 124.16 | |
| MAexp20: | 124.21 | |
| MAexp50: | 125.48 | |
| MAexp100: | 129.81 | |
| Price / MA7: | +4.51% | |
| Price / MA20: | +3.02% | |
| Price / MA50: | +2.50% | |
| Price / MA100: | +0.40% | |
| Price / MAexp7: | +3.40% | |
| Price / MAexp20: | +3.36% | |
| Price / MAexp50: | +2.31% | |
| Price / MAexp100: | -1.10% |
About author
Online


Add a comment
Comments
0 comments on the analysis SHORTDAX X2 TR - Daily