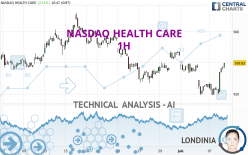
NASDAQ HEALTH CARE - 1H - Technical analysis published on 07/10/2023 (GMT)
- 132
- 0
Click here for a new analysis!
- Timeframe : 1H
- - Analysis generated on
- Status : TARGET REACHED

Summary of the analysis

Additional analysis
Quotes
NASDAQ HEALTH CARE rating 939.83 USD. The price registered an increase of +2.11% on the session with the lowest point at 921.27 USD and the highest point at 939.86 USD. The deviation from the price is +2.01% for the low point and +0.00% for the high point.The Central Gaps scanner detects a bullish opening marking the presence of buyers ahead of sellers at the opening but not sufficiently marked to allow the price to register a quotation gap.
Bullish opening
Type : Bullish
Timeframe : Openning
So that you have an overall view of the price change, here is a table showing the variations over several periods:
Near a new HIGH record (1 year)
Type : Bullish
Timeframe : Weekly
Near a new HIGH record (1st january)
Type : Bullish
Timeframe : Weekly
Near a new HIGH record (1 month)
Type : Bullish
Timeframe : Weekly
Technical
A technical analysis in 1H of this NASDAQ HEALTH CARE chart shows a slightly bullish trend. 57.14% of the signals given by moving averages are bullish. This slightly bullish trend could be reinforced by the strong bullish signals given by short-term moving averages. The Central Indicators market scanner is currently detecting several bullish signals that could impact this trend:
Bullish trend reversal : Moving Average 20
Type : Bullish
Timeframe : 1 hour
Bullish trend reversal : adaptative moving average 100
Type : Bullish
Timeframe : 1 hour
The probability of a further increase is high given the direction of the technical indicators.
Caution: the Central Indicators scanner currently detects an excess:
CCI indicator is overbought : over 100
Type : Neutral
Timeframe : 1 hour
Williams %R indicator is overbought : over -20
Type : Neutral
Timeframe : 1 hour
Pivot points : price is over resistance 1
Type : Neutral
Timeframe : Weekly
Pivot points : price is over resistance 3
Type : Neutral
Timeframe : 1 hour
No signals are given by Central Patterns, a market scanner specialised in chart patterns, resistances and supports.
The Central Candlesticks scanner which studies Japanese candlesticks did not detect anything.
| S3 | S2 | S1 | Price | R1 | R2 | R3 | |
|---|---|---|---|---|---|---|---|
| ProTrendLines | 919.24 | 927.04 | 935.50 | 939.83 | 946.34 | 961.16 | 966.08 |
| Change (%) | -2.19% | -1.36% | -0.46% | - | +0.69% | +2.27% | +2.79% |
| Change | -20.59 | -12.79 | -4.33 | - | +6.51 | +21.33 | +26.25 |
| Level | Intermediate | Intermediate | Minor | - | Intermediate | Minor | Major |
Attention could also be paid to pivot points to set price objectives:
| Pivot points | S3 | S2 | S1 | PP | R1 | R2 | R3 |
|---|---|---|---|---|---|---|---|
| Standard | 909.50 | 914.34 | 917.38 | 922.22 | 925.26 | 930.10 | 933.14 |
| Camarilla | 918.24 | 918.97 | 919.69 | 920.41 | 921.13 | 921.86 | 922.58 |
| Woodie | 908.59 | 913.89 | 916.47 | 921.77 | 924.35 | 929.65 | 932.23 |
| Fibonacci | 914.34 | 917.35 | 919.21 | 922.22 | 925.23 | 927.09 | 930.10 |
| Pivot points | S3 | S2 | S1 | PP | R1 | R2 | R3 |
|---|---|---|---|---|---|---|---|
| Standard | 892.94 | 906.06 | 913.24 | 926.36 | 933.54 | 946.66 | 953.84 |
| Camarilla | 914.83 | 916.69 | 918.55 | 920.41 | 922.27 | 924.13 | 925.99 |
| Woodie | 889.96 | 904.58 | 910.26 | 924.88 | 930.56 | 945.18 | 950.86 |
| Fibonacci | 906.06 | 913.82 | 918.61 | 926.36 | 934.12 | 938.91 | 946.66 |
| Pivot points | S3 | S2 | S1 | PP | R1 | R2 | R3 |
|---|---|---|---|---|---|---|---|
| Standard | 854.34 | 883.29 | 913.98 | 942.93 | 973.62 | 1,002.57 | 1,033.26 |
| Camarilla | 928.28 | 933.75 | 939.21 | 944.68 | 950.15 | 955.61 | 961.08 |
| Woodie | 855.22 | 883.73 | 914.86 | 943.37 | 974.50 | 1,003.01 | 1,034.14 |
| Fibonacci | 883.29 | 906.07 | 920.14 | 942.93 | 965.71 | 979.78 | 1,002.57 |
Numerical data
The following are the details of the technical indicators and moving averages that were collected to generate this technical analysis:
| RSI (14): | 61.55 | |
| MACD (12,26,9): | -0.0300 | |
| Directional Movement: | 11.35 | |
| AROON (14): | 57.14 | |
| DEMA (21): | 929.00 | |
| Parabolic SAR (0,02-0,02-0,2): | 921.21 | |
| Elder Ray (13): | 7.67 | |
| Super Trend (3,10): | 926.38 | |
| Zig ZAG (10): | 939.01 | |
| VORTEX (21): | 1.1100 | |
| Stochastique (14,3,5): | 98.95 | |
| TEMA (21): | 931.19 | |
| Williams %R (14): | -2.45 | |
| Chande Momentum Oscillator (20): | 12.62 | |
| Repulse (5,40,3): | 1.0000 | |
| ROCnROLL: | 1 | |
| TRIX (15,9): | -0.0400 | |
| Courbe Coppock: | 0.95 |
| MA7: | 934.24 | |
| MA20: | 943.30 | |
| MA50: | 941.32 | |
| MA100: | 930.85 | |
| MAexp7: | 932.77 | |
| MAexp20: | 930.12 | |
| MAexp50: | 933.30 | |
| MAexp100: | 937.16 | |
| Price / MA7: | +0.60% | |
| Price / MA20: | -0.37% | |
| Price / MA50: | -0.16% | |
| Price / MA100: | +0.96% | |
| Price / MAexp7: | +0.76% | |
| Price / MAexp20: | +1.04% | |
| Price / MAexp50: | +0.70% | |
| Price / MAexp100: | +0.28% |
About author
Online


Add a comment
Comments
0 comments on the analysis NASDAQ HEALTH CARE - 1H