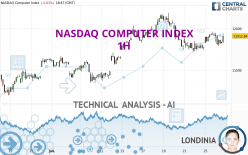
NASDAQ COMPUTER INDEX - 1H - Technical analysis published on 07/26/2023 (GMT)
- 149
- 0
Click here for a new analysis!
- Timeframe : 1H
- - Analysis generated on
- Status : TARGET REACHED

Summary of the analysis

Additional analysis
Quotes
NASDAQ COMPUTER INDEX rating 11,912.84 USD. The price is lower by -0.01% since the last closing with the lowest point at 11,790.70 USD and the highest point at 11,949.29 USD. The deviation from the price is +1.04% for the low point and -0.31% for the high point.The Central Gaps scanner detects a bullish opening marking the presence of buyers ahead of sellers at the opening but not sufficiently marked to allow the price to register a quotation gap.
Bullish opening
Type : Bullish
Timeframe : Openning
So that you have an overall view of the price change, here is a table showing the variations over several periods:
Near a new HIGH record (5 years)
Type : Bullish
Timeframe : Weekly
Near a new HIGH record (1 year)
Type : Bullish
Timeframe : Weekly
Near a new HIGH record (1st january)
Type : Bullish
Timeframe : Weekly
Near a new HIGH record (1 month)
Type : Bullish
Timeframe : Weekly
Technical
A technical analysis in 1H of this NASDAQ COMPUTER INDEX chart shows a strongly bullish trend. The signals given by the moving averages are 82.14% bullish. This strong bullish trend is confirmed by the strong signals currently being given by short-term moving averages. An assessment of moving averages reveals several bullish signals that could impact this trend:
Bullish price crossover with Moving Average 20
Type : Bullish
Timeframe : 1 hour
Bullish price crossover with adaptative moving average 100
Type : Bullish
Timeframe : 1 hour
In fact, according to the parameters integrated into the Central Analyzer system, only 7 technical indicators out of 18 analysed are currently bullish. Caution: the Central Indicators scanner currently detects an excess:
MACD indicator: bullish divergence
Type : Bullish
Timeframe : 1 hour
MACD crosses DOWN its Moving Average
Type : Bearish
Timeframe : 1 hour
Momentum indicator is back under 0
Type : Bearish
Timeframe : 1 hour
Williams %R indicator is back over -50
Type : Bullish
Timeframe : 1 hour
No signals are given by Central Patterns, a market scanner specialised in chart patterns, resistances and supports.
The Central Candlesticks scanner, specialised in Japanese candlesticks, did not identify any signals.
| S3 | S2 | S1 | Price | R1 | R2 | R3 | |
|---|---|---|---|---|---|---|---|
| ProTrendLines | 11,342.80 | 11,644.30 | 11,850.70 | 11,912.84 | 12,036.50 | 12,187.00 | 12,408.60 |
| Change (%) | -4.79% | -2.25% | -0.52% | - | +1.04% | +2.30% | +4.16% |
| Change | -570.04 | -268.54 | -62.14 | - | +123.66 | +274.16 | +495.76 |
| Level | Intermediate | Major | Minor | - | Minor | Intermediate | Major |
Pivot points can also be used to set your price objectives. Here is the price situation in relation to pivot points:
| Pivot points | S3 | S2 | S1 | PP | R1 | R2 | R3 |
|---|---|---|---|---|---|---|---|
| Standard | 11,704.83 | 11,766.16 | 11,840.22 | 11,901.55 | 11,975.61 | 12,036.94 | 12,111.00 |
| Camarilla | 11,877.06 | 11,889.47 | 11,901.88 | 11,914.29 | 11,926.70 | 11,939.11 | 11,951.52 |
| Woodie | 11,711.21 | 11,769.34 | 11,846.60 | 11,904.73 | 11,981.99 | 12,040.12 | 12,117.38 |
| Fibonacci | 11,766.16 | 11,817.88 | 11,849.83 | 11,901.55 | 11,953.27 | 11,985.22 | 12,036.94 |
| Pivot points | S3 | S2 | S1 | PP | R1 | R2 | R3 |
|---|---|---|---|---|---|---|---|
| Standard | 11,106.56 | 11,412.91 | 11,575.66 | 11,882.01 | 12,044.76 | 12,351.11 | 12,513.86 |
| Camarilla | 11,609.40 | 11,652.40 | 11,695.40 | 11,738.40 | 11,781.40 | 11,824.40 | 11,867.40 |
| Woodie | 11,034.75 | 11,377.01 | 11,503.85 | 11,846.11 | 11,972.95 | 12,315.21 | 12,442.05 |
| Fibonacci | 11,412.91 | 11,592.11 | 11,702.82 | 11,882.01 | 12,061.21 | 12,171.92 | 12,351.11 |
| Pivot points | S3 | S2 | S1 | PP | R1 | R2 | R3 |
|---|---|---|---|---|---|---|---|
| Standard | 10,312.14 | 10,620.06 | 11,121.04 | 11,428.96 | 11,929.94 | 12,237.86 | 12,738.84 |
| Camarilla | 11,399.58 | 11,473.73 | 11,547.88 | 11,622.03 | 11,696.18 | 11,770.33 | 11,844.48 |
| Woodie | 10,408.68 | 10,668.33 | 11,217.58 | 11,477.23 | 12,026.48 | 12,286.13 | 12,835.38 |
| Fibonacci | 10,620.06 | 10,929.06 | 11,119.96 | 11,428.96 | 11,737.96 | 11,928.86 | 12,237.86 |
Numerical data
The following is the status of technical indicators and moving averages registered at the time this technical analysis was created:
| RSI (14): | 50.34 | |
| MACD (12,26,9): | -1.4900 | |
| Directional Movement: | 1.80 | |
| AROON (14): | 42.86 | |
| DEMA (21): | 11,853.97 | |
| Parabolic SAR (0,02-0,02-0,2): | 11,926.42 | |
| Elder Ray (13): | -6.51 | |
| Super Trend (3,10): | 11,944.36 | |
| Zig ZAG (10): | 11,863.85 | |
| VORTEX (21): | 1.0100 | |
| Stochastique (14,3,5): | 44.20 | |
| TEMA (21): | 11,859.89 | |
| Williams %R (14): | -46.90 | |
| Chande Momentum Oscillator (20): | -39.06 | |
| Repulse (5,40,3): | 0.0800 | |
| ROCnROLL: | 1 | |
| TRIX (15,9): | -0.0100 | |
| Courbe Coppock: | 1.15 |
| MA7: | 11,890.90 | |
| MA20: | 11,711.94 | |
| MA50: | 11,289.50 | |
| MA100: | 10,423.97 | |
| MAexp7: | 11,853.62 | |
| MAexp20: | 11,859.10 | |
| MAexp50: | 11,854.94 | |
| MAexp100: | 11,785.74 | |
| Price / MA7: | +0.18% | |
| Price / MA20: | +1.72% | |
| Price / MA50: | +5.52% | |
| Price / MA100: | +14.28% | |
| Price / MAexp7: | +0.50% | |
| Price / MAexp20: | +0.45% | |
| Price / MAexp50: | +0.49% | |
| Price / MAexp100: | +1.08% |
About author
Online


Add a comment
Comments
0 comments on the analysis NASDAQ COMPUTER INDEX - 1H