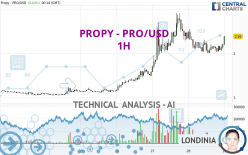
PROPY - PRO/USD - 1H - Technical analysis published on 03/29/2024 (GMT)
- 149
- 0
Click here for a new analysis!
- Timeframe : 1H
- - Analysis generated on
- Status : INVALID

Summary of the analysis

Additional analysis
Quotes
PROPY - PRO/USD rating 2.39 USD. The price has increased by +8.64% since the last closing and was traded between 2.20 USD and 2.40 USD over the period. The price is currently at +8.64% from its lowest and -0.42% from its highest.A bullish opening was detected by the Central Gaps scanner. Buyers are trying to impose a bullish momentum in the very short term.
Bullish opening
Type : Bullish
Timeframe : Openning
A study of price movements over other periods shows the following variations:
Abnormal volumes
Timeframe : 5 days
Abnormal volumes
Timeframe : 20 days
Abnormal volumes
Timeframe : 50 days
Technical
Technical analysis of this 1H chart of PROPY - PRO/USD indicates that the overall trend is strongly bullish. 85.71% of the signals given by moving averages are bullish. The slightly bullish signals given by the short-term moving averages show a weakening of the global trend. An assessment of moving averages reveals several bullish signals that could impact this trend:
Bullish trend reversal : adaptative moving average 20
Type : Bullish
Timeframe : 1 hour
Bullish price crossover with adaptative moving average 20
Type : Bullish
Timeframe : 1 hour
Bullish price crossover with adaptative moving average 50
Type : Bullish
Timeframe : 1 hour
In fact, according to the parameters integrated into the Central Analyzer system, 12 technical indicators out of 18 analysed are currently bullish. Caution: the Central Indicators scanner currently detects an excess:
CCI indicator is overbought : over 100
Type : Neutral
Timeframe : 1 hour
Williams %R indicator is overbought : over -20
Type : Neutral
Timeframe : 1 hour
Pivot points : price is over resistance 3
Type : Neutral
Timeframe : Weekly
RSI indicator is back over 50
Type : Bullish
Timeframe : 1 hour
MACD crosses UP its Moving Average
Type : Bullish
Timeframe : 1 hour
No signals are given by Central Patterns, a market scanner specialised in chart patterns, resistances and supports.
No result was found by the Central Candlesticks scanner on Japanese candlesticks.
| S3 | S2 | S1 | Price | R1 | R2 | R3 | |
|---|---|---|---|---|---|---|---|
| ProTrendLines | 1.21 | 1.37 | 1.58 | 2.39 | 2.49 | 2.70 | 2.92 |
| Change (%) | -49.37% | -42.68% | -33.89% | - | +4.18% | +12.97% | +22.18% |
| Change | -1.18 | -1.02 | -0.81 | - | +0.10 | +0.31 | +0.53 |
| Level | Major | Minor | Minor | - | Minor | Minor | Intermediate |
Pivot points can also be used to set your price objectives. Here is the price situation in relation to pivot points:
| Pivot points | S3 | S2 | S1 | PP | R1 | R2 | R3 |
|---|---|---|---|---|---|---|---|
| Standard | 1.39 | 1.69 | 1.95 | 2.25 | 2.51 | 2.81 | 3.07 |
| Camarilla | 2.05 | 2.10 | 2.15 | 2.20 | 2.25 | 2.30 | 2.35 |
| Woodie | 1.36 | 1.68 | 1.92 | 2.24 | 2.48 | 2.80 | 3.04 |
| Fibonacci | 1.69 | 1.91 | 2.04 | 2.25 | 2.47 | 2.60 | 2.81 |
| Pivot points | S3 | S2 | S1 | PP | R1 | R2 | R3 |
|---|---|---|---|---|---|---|---|
| Standard | 0.15 | 0.53 | 0.81 | 1.19 | 1.47 | 1.85 | 2.13 |
| Camarilla | 0.90 | 0.96 | 1.02 | 1.08 | 1.14 | 1.20 | 1.26 |
| Woodie | 0.09 | 0.51 | 0.75 | 1.17 | 1.41 | 1.83 | 2.07 |
| Fibonacci | 0.53 | 0.79 | 0.94 | 1.19 | 1.45 | 1.60 | 1.85 |
| Pivot points | S3 | S2 | S1 | PP | R1 | R2 | R3 |
|---|---|---|---|---|---|---|---|
| Standard | 0.26 | 0.36 | 0.43 | 0.53 | 0.60 | 0.70 | 0.77 |
| Camarilla | 0.45 | 0.47 | 0.48 | 0.50 | 0.52 | 0.53 | 0.55 |
| Woodie | 0.25 | 0.35 | 0.42 | 0.52 | 0.59 | 0.69 | 0.76 |
| Fibonacci | 0.36 | 0.43 | 0.47 | 0.53 | 0.60 | 0.64 | 0.70 |
Numerical data
The following is the status of the technical indicators and moving averages at the time of publication of this technical analysis:
| RSI (14): | 52.36 | |
| MACD (12,26,9): | -0.0100 | |
| Directional Movement: | 7.56 | |
| AROON (14): | -21.43 | |
| DEMA (21): | 2.16 | |
| Parabolic SAR (0,02-0,02-0,2): | 2.03 | |
| Elder Ray (13): | 0.06 | |
| Super Trend (3,10): | 2.48 | |
| Zig ZAG (10): | 2.21 | |
| VORTEX (21): | 1.0400 | |
| Stochastique (14,3,5): | 75.52 | |
| TEMA (21): | 2.12 | |
| Williams %R (14): | -2.80 | |
| Chande Momentum Oscillator (20): | 0.20 | |
| Repulse (5,40,3): | 6.9200 | |
| ROCnROLL: | 1 | |
| TRIX (15,9): | -0.1900 | |
| Courbe Coppock: | 1.94 |
| MA7: | 1.67 | |
| MA20: | 1.20 | |
| MA50: | 0.79 | |
| MA100: | 0.64 | |
| MAexp7: | 2.21 | |
| MAexp20: | 2.17 | |
| MAexp50: | 2.10 | |
| MAexp100: | 1.88 | |
| Price / MA7: | +43.11% | |
| Price / MA20: | +99.17% | |
| Price / MA50: | +202.53% | |
| Price / MA100: | +273.44% | |
| Price / MAexp7: | +8.14% | |
| Price / MAexp20: | +10.14% | |
| Price / MAexp50: | +13.81% | |
| Price / MAexp100: | +27.13% |
About author
Online


Add a comment
Comments
0 comments on the analysis PROPY - PRO/USD - 1H