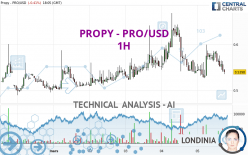
PROPY - PRO/USD - 1H - Technical analysis published on 03/05/2024 (GMT)
- 104
- 0
Click here for a new analysis!
- Timeframe : 1H
- - Analysis generated on
- Status : TARGET REACHED

Summary of the analysis

Additional analysis
Quotes
The PROPY - PRO/USD rating is 0.539800 USD. The price is lower by -0.41% since the last closing and was between 0.526400 USD and 0.599000 USD. This implies that the price is at +2.55% from its lowest and at -9.88% from its highest.A study of price movements over other periods shows the following variations:
Abnormal volumes
Timeframe : 5 days
Abnormal volumes
Timeframe : 20 days
Technical
A technical analysis in 1H of this PROPY - PRO/USD chart shows a slightly bearish trend. 60.71% of the signals given by moving averages are bearish. The overall trend remains fragile, reflecting the slightly bearish signals given by short-term moving averages. The Central Indicators market scanner is currently detecting several bearish signals that could impact this trend:
Bearish trend reversal : adaptative moving average 100
Type : Bearish
Timeframe : 1 hour
Bearish price crossover with Moving Average 20
Type : Bearish
Timeframe : 1 hour
Bearish price crossover with Moving Average 100
Type : Bearish
Timeframe : 1 hour
Bearish price crossover with adaptative moving average 20
Type : Bearish
Timeframe : 1 hour
Bearish price crossover with adaptative moving average 100
Type : Bearish
Timeframe : 1 hour
In fact, of the 18 technical indicators analysed by Central Analyzer, 4 are bullish, 6 are neutral and 8 are bearish. Caution: the Central Indicators scanner currently detects an excess:
Williams %R indicator is oversold : under -80
Type : Neutral
Timeframe : 1 hour
MACD crosses DOWN its Moving Average
Type : Bearish
Timeframe : 1 hour
MACD indicator is back under 0
Type : Bearish
Timeframe : 1 hour
Central Patterns, the scanner specializing in chart patterns, did not identify any signals.
The Central Candlesticks scanner which studies Japanese candlesticks did not detect anything.
| S3 | S2 | S1 | Price | R1 | R2 | R3 | |
|---|---|---|---|---|---|---|---|
| ProTrendLines | 0.502740 | 0.522200 | 0.537269 | 0.539800 | 0.571900 | 0.600400 | 0.617533 |
| Change (%) | -6.87% | -3.26% | -0.47% | - | +5.95% | +11.23% | +14.40% |
| Change | -0.037060 | -0.017600 | -0.002531 | - | +0.032100 | +0.060600 | +0.077733 |
| Level | Intermediate | Minor | Major | - | Minor | Minor | Minor |
To determine price objectives, it is also possible to use the pivot points. Here is the price position in relation to pivot points:
| Pivot points | S3 | S2 | S1 | PP | R1 | R2 | R3 |
|---|---|---|---|---|---|---|---|
| Standard | 0.365067 | 0.450733 | 0.496367 | 0.582033 | 0.627667 | 0.713333 | 0.758967 |
| Camarilla | 0.505893 | 0.517928 | 0.529964 | 0.542000 | 0.554036 | 0.566072 | 0.578108 |
| Woodie | 0.345050 | 0.440725 | 0.476350 | 0.572025 | 0.607650 | 0.703325 | 0.738950 |
| Fibonacci | 0.450733 | 0.500890 | 0.531877 | 0.582033 | 0.632190 | 0.663177 | 0.713333 |
| Pivot points | S3 | S2 | S1 | PP | R1 | R2 | R3 |
|---|---|---|---|---|---|---|---|
| Standard | 0.347533 | 0.411267 | 0.472933 | 0.536667 | 0.598333 | 0.662067 | 0.723733 |
| Camarilla | 0.500115 | 0.511610 | 0.523105 | 0.534600 | 0.546095 | 0.557590 | 0.569085 |
| Woodie | 0.346500 | 0.410750 | 0.471900 | 0.536150 | 0.597300 | 0.661550 | 0.722700 |
| Fibonacci | 0.411267 | 0.459170 | 0.488764 | 0.536667 | 0.584570 | 0.614164 | 0.662067 |
| Pivot points | S3 | S2 | S1 | PP | R1 | R2 | R3 |
|---|---|---|---|---|---|---|---|
| Standard | 0.251933 | 0.352767 | 0.428733 | 0.529567 | 0.605533 | 0.706367 | 0.782333 |
| Camarilla | 0.456080 | 0.472287 | 0.488493 | 0.504700 | 0.520907 | 0.537113 | 0.553320 |
| Woodie | 0.239500 | 0.346550 | 0.416300 | 0.523350 | 0.593100 | 0.700150 | 0.769900 |
| Fibonacci | 0.352767 | 0.420304 | 0.462029 | 0.529567 | 0.597104 | 0.638829 | 0.706367 |
Numerical data
The following are the details of the technical indicators and moving averages that were collected to generate this technical analysis:
| RSI (14): | 43.04 | |
| MACD (12,26,9): | -0.0008 | |
| Directional Movement: | 4.326494 | |
| AROON (14): | 21.428571 | |
| DEMA (21): | 0.558855 | |
| Parabolic SAR (0,02-0,02-0,2): | 0.540867 | |
| Elder Ray (13): | -0.007016 | |
| Super Trend (3,10): | 0.593292 | |
| Zig ZAG (10): | 0.545000 | |
| VORTEX (21): | 1.0005 | |
| Stochastique (14,3,5): | 32.30 | |
| TEMA (21): | 0.558950 | |
| Williams %R (14): | -80.39 | |
| Chande Momentum Oscillator (20): | 0.007100 | |
| Repulse (5,40,3): | -4.5514 | |
| ROCnROLL: | 2 | |
| TRIX (15,9): | -0.0180 | |
| Courbe Coppock: | 7.89 |
| MA7: | 0.527657 | |
| MA20: | 0.504330 | |
| MA50: | 0.498432 | |
| MA100: | 0.504108 | |
| MAexp7: | 0.560088 | |
| MAexp20: | 0.560073 | |
| MAexp50: | 0.559476 | |
| MAexp100: | 0.551263 | |
| Price / MA7: | +2.30% | |
| Price / MA20: | +7.03% | |
| Price / MA50: | +8.30% | |
| Price / MA100: | +7.08% | |
| Price / MAexp7: | -3.62% | |
| Price / MAexp20: | -3.62% | |
| Price / MAexp50: | -3.52% | |
| Price / MAexp100: | -2.08% |
About author
Online


Add a comment
Comments
0 comments on the analysis PROPY - PRO/USD - 1H