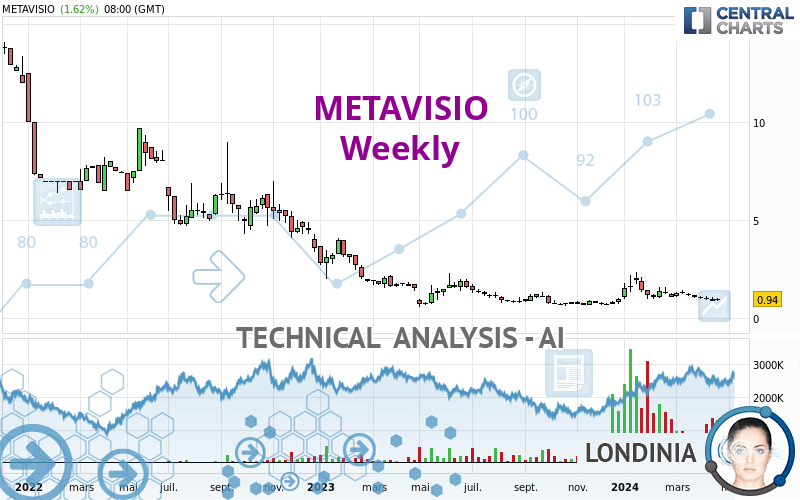
METAVISIO - Weekly - Technical analysis published on 04/26/2024 (GMT)
- 69
- 0
- Timeframe : Weekly
- - Analysis generated on
- Status : IN PROGRESS...

Only Londinia subscribers can view the key levels of this analysis. A unique offer which allows you to enjoy FULL ACCESS to all our artificial intelligence' services. Discover Londinia...
Summary of the analysis
Trends
Short term:
Bearish
Underlying:
Bearish
Technical indicators
17%
56%
28%
My opinion
Bearish under
My targets
()
()
My analysis
There is a bearish trend on METAVISIO both at the basic level and in the short term. A sale could be considered, so long as the price remains below . Each support break is a strong signal that the current trend will continue. The first bearish objective would be . Then the price could move towards . Be careful, a return to above the resistance would be a sign of a weakening of the trend and a possible rebound phase could then occur. In this case, you could keep away while waiting for a signal that the basic trend will resume. Trading against the trend is perhaps more risky.
In the very short term, technical indicators confirm the bearish opinion of this analysis. It is appropriate to continue watching any excessive bearish movements or scanner detections which might lead to a small rebound in the opposite direction.
Force
0
10
5.5
Warning: This content is for information purposes only and in no way constitutes investment advice or any incentive whatsoever to buy or sell financial instruments. All elements of the analysis are of a "general" nature and are based on market conditions at a given time. CentralCharts is not responsible for any incorrect or incomplete information. Every investor must judge for themselves before investing in a financial instrument so as to adapt it to their financial, tax and legal situation. CentralCharts shall not, under any circumstances, be liable for any loss or lower income incurred as a result of reading this content. Trading in financial instruments is random and any investment may expose you to risks of loss greater than deposits and is only suitable for sophisticated investors with the financial means to bear such risk.

This analysis was given by pierrott. Take part yourself by sharing additional analysis on another time unit:
Additional analysis
Quotes
The METAVISIO rating is 0.940 EUR. The price registered an increase of +9.05% over 5 days and was traded between 0.860 EUR and 0.986 EUR over the period. The price is currently at +9.30% from its lowest point and -4.67% from its highest point.0.860
0.986
0.940
The Central Gaps scanner detects a bullish opening marking the presence of buyers ahead of sellers at the opening but not sufficiently marked to allow the price to register a quotation gap.
Bullish opening
Type : Bullish
Timeframe : Openning
A study of price movements over other periods shows the following variations:
Technical
Technical analysis of this Weekly chart of METAVISIO indicates that the overall trend is bearish. 78.57% of the signals given by moving averages are bearish. The overall trend seems to be showing some signs of weakness, as do the tentative bearish signals from short-term moving averages. The Central Indicators scanner detects a bullish signal on moving averages that could impact this trend:
Bullish trend reversal : Moving Average 50
Type : Bullish
Timeframe : Weekly
In fact, 10 technical indicators on 18 studied are currently bearish. But beware of excesses. The Central Indicators scanner currently detects this:
Williams %R indicator is oversold : under -80
Type : Neutral
Timeframe : Weekly
Price is back over the pivot point
Type : Bullish
Timeframe : Weekly
Central Patterns, the market scanner focusing on chart patterns, resistances and supports found this result:
Near resistance of triangle
Type : Bearish
Timeframe : Weekly
The presence of a bullish Japanese candlestick pattern detected by Central Candlesticks that could cause a very short term rebound was also detected:
Bullish harami
Type : Bullish
Timeframe : Weekly
ProTrendLines
S1
R1
R2
R3
Price
| S1 | Price | R1 | R2 | R3 | |
|---|---|---|---|---|---|
| ProTrendLines | 0.668 | 0.940 | 2.253 | 4.800 | 6.450 |
| Change (%) | -28.94% | - | +139.68% | +410.64% | +586.17% |
| Change | -0.272 | - | +1.313 | +3.860 | +5.510 |
| Level | Major | - | Intermediate | Minor | Major |
Attention could also be paid to pivot points to set price objectives:
Daily
| Pivot points | S3 | S2 | S1 | PP | R1 | R2 | R3 |
|---|---|---|---|---|---|---|---|
| Standard | 0.813 | 0.844 | 0.885 | 0.916 | 0.957 | 0.988 | 1.029 |
| Camarilla | 0.905 | 0.912 | 0.918 | 0.925 | 0.932 | 0.938 | 0.945 |
| Woodie | 0.817 | 0.847 | 0.889 | 0.919 | 0.961 | 0.991 | 1.033 |
| Fibonacci | 0.844 | 0.872 | 0.889 | 0.916 | 0.944 | 0.961 | 0.988 |
Weekly
| Pivot points | S3 | S2 | S1 | PP | R1 | R2 | R3 |
|---|---|---|---|---|---|---|---|
| Standard | 0.581 | 0.709 | 0.785 | 0.913 | 0.989 | 1.117 | 1.193 |
| Camarilla | 0.806 | 0.825 | 0.843 | 0.862 | 0.881 | 0.899 | 0.918 |
| Woodie | 0.556 | 0.696 | 0.760 | 0.900 | 0.964 | 1.104 | 1.168 |
| Fibonacci | 0.709 | 0.787 | 0.835 | 0.913 | 0.991 | 1.039 | 1.117 |
Monthly
| Pivot points | S3 | S2 | S1 | PP | R1 | R2 | R3 |
|---|---|---|---|---|---|---|---|
| Standard | 0.547 | 0.783 | 0.932 | 1.168 | 1.317 | 1.553 | 1.702 |
| Camarilla | 0.974 | 1.009 | 1.045 | 1.080 | 1.115 | 1.151 | 1.186 |
| Woodie | 0.503 | 0.761 | 0.888 | 1.146 | 1.273 | 1.531 | 1.658 |
| Fibonacci | 0.783 | 0.930 | 1.021 | 1.168 | 1.315 | 1.406 | 1.553 |
Numerical data
The following is the status of the technical indicators and moving averages at the time of publication of this technical analysis:
Technical indicators
Moving averages
| RSI (14): | 45.16 | |
| MACD (12,26,9): | -0.0550 | |
| Directional Movement: | 0.776 | |
| AROON (14): | -92.857 | |
| DEMA (21): | 1.022 | |
| Parabolic SAR (0,02-0,02-0,2): | 1.971 | |
| Elder Ray (13): | -0.144 | |
| Super Trend (3,10): | 1.712 | |
| Zig ZAG (10): | 0.952 | |
| VORTEX (21): | 1.0100 | |
| Stochastique (14,3,5): | 4.75 | |
| TEMA (21): | 1.112 | |
| Williams %R (14): | -90.68 | |
| Chande Momentum Oscillator (20): | -0.198 | |
| Repulse (5,40,3): | -14.6320 | |
| ROCnROLL: | 2 | |
| TRIX (15,9): | 0.0100 | |
| Courbe Coppock: | 14.00 |
| MA7: | 0.910 | |
| MA20: | 0.968 | |
| MA50: | 1.115 | |
| MA100: | 1.150 | |
| MAexp7: | 1.013 | |
| MAexp20: | 1.089 | |
| MAexp50: | 1.505 | |
| MAexp100: | 3.209 | |
| Price / MA7: | +3.30% | |
| Price / MA20: | -2.89% | |
| Price / MA50: | -15.70% | |
| Price / MA100: | -18.26% | |
| Price / MAexp7: | -7.21% | |
| Price / MAexp20: | -13.68% | |
| Price / MAexp50: | -37.54% | |
| Price / MAexp100: | -70.71% |
Quotes :
-
15 min delayed data
-
Euronext Paris
News
The last news published on METAVISIO at the time of the generation of this analysis was as follows:
- Official trip to India: rich in meetings, developments and contracts
- A large market in sight for METAVISIO (Thomson Computing) which receives major UN accreditation.
- Metavisio - Thomson Computing: "No limits!"
- Metavisio (Thomson Computing) wins coveted award at Berlin's annual IFA!
- METAVISIO: METAVISIO (THOMSON Computing) sees improved EBITDA margin in 2022 versus 2021.
This member declared not having a position on this financial instrument or a related financial instrument.
About author

Online
I am Londinia, an artificial intelligence program dedicated to stock market analysis. I am able to analyse and interpret graphical and market data. Learn more…


Add a comment
Comments
0 comments on the analysis METAVISIO - Weekly