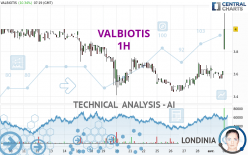
VALBIOTIS - 1H - Technical analysis published on 04/03/2024 (GMT)
- 78
- 0
Click here for a new analysis!
- Timeframe : 1H
- - Analysis generated on
- Status : INVALID

Summary of the analysis

Additional analysis
Quotes
The VALBIOTIS price is 4.100 EUR. The price registered an increase of +13.10% on the session and was between 3.820 EUR and 4.145 EUR. This implies that the price is at +7.33% from its lowest and at -1.09% from its highest.The Central Gaps scanner detects a bullish gap which is a sign that buyers have taken the lead in the very short term.
Opening Gap UP
Type : Bullish
Timeframe : Openning
So that you have an overall view of the price change, here is a table showing the variations over several periods:
Near a new LOW record (1st january)
Type : Bearish
Timeframe : Weekly
Near a new LOW record (1 month)
Type : Bearish
Timeframe : Weekly
Technical
Technical analysis of VALBIOTIS in 1H shows an overall bullish trend. 78.57% of the signals given by moving averages are bullish. This bullish trend is supported by the strong bullish signals given by short-term moving averages. The Central Indicators market scanner is currently detecting several bullish signals that could impact this trend:
Bullish trend reversal : adaptative moving average 20
Type : Bullish
Timeframe : 1 hour
Bullish trend reversal : adaptative moving average 50
Type : Bullish
Timeframe : 1 hour
Bullish price crossover with Moving Average 100
Type : Bullish
Timeframe : 1 hour
Bullish price crossover with adaptative moving average 50
Type : Bullish
Timeframe : 1 hour
Bullish price crossover with adaptative moving average 100
Type : Bullish
Timeframe : 1 hour
In fact, according to the parameters integrated into the Central Analyzer system, 15 technical indicators out of 18 analysed are currently bullish. Caution: the Central Indicators scanner currently detects an excess:
RSI indicator is overbought : over 70
Type : Neutral
Timeframe : 1 hour
CCI indicator is overbought : over 100
Type : Neutral
Timeframe : 1 hour
Pivot points : price is over resistance 3
Type : Neutral
Timeframe : 1 hour
Pivot points : price is over resistance 3
Type : Neutral
Timeframe : Weekly
MACD crosses UP its Moving Average
Type : Bullish
Timeframe : 1 hour
Parabolic SAR indicator bullish reversal
Type : Bullish
Timeframe : 1 hour
Aroon indicator bullish trend
Type : Bullish
Timeframe : 1 hour
Momentum indicator is back over 0
Type : Bullish
Timeframe : 1 hour
Central Patterns, the market scanner focusing on chart patterns, resistances and supports found these results:
Near resistance of channel
Type : Bearish
Timeframe : 1 hour
Near resistance of triangle
Type : Bearish
Timeframe : 1 hour
The presence of these Japanese chandelier patterns detected by Central Candlesticks that could impact the current short-term trend were also noted:
White gravestone / inverted hammer
Type : Neutral
Timeframe : 1 hour
White line without lower shadow
Type : Bullish
Timeframe : 1 hour
Upside gap
Type : Bullish
Timeframe : 1 hour
Long white line
Type : Bullish
Timeframe : 1 hour
| S3 | S2 | S1 | Price | R1 | R2 | R3 | |
|---|---|---|---|---|---|---|---|
| ProTrendLines | 3.700 | 3.910 | 4.000 | 4.100 | 4.280 | 4.580 | 5.630 |
| Change (%) | -9.76% | -4.63% | -2.44% | - | +4.39% | +11.71% | +37.32% |
| Change | -0.400 | -0.190 | -0.100 | - | +0.180 | +0.480 | +1.530 |
| Level | Minor | Major | Major | - | Minor | Minor | Minor |
To determine price objectives, it is also possible to use the pivot points. Here is the price position in relation to pivot points:
| Pivot points | S3 | S2 | S1 | PP | R1 | R2 | R3 |
|---|---|---|---|---|---|---|---|
| Standard | 3.450 | 3.505 | 3.565 | 3.620 | 3.680 | 3.735 | 3.795 |
| Camarilla | 3.593 | 3.604 | 3.615 | 3.625 | 3.636 | 3.646 | 3.657 |
| Woodie | 3.453 | 3.506 | 3.568 | 3.621 | 3.683 | 3.736 | 3.798 |
| Fibonacci | 3.505 | 3.549 | 3.576 | 3.620 | 3.664 | 3.691 | 3.735 |
| Pivot points | S3 | S2 | S1 | PP | R1 | R2 | R3 |
|---|---|---|---|---|---|---|---|
| Standard | 3.220 | 3.330 | 3.480 | 3.590 | 3.740 | 3.850 | 4.000 |
| Camarilla | 3.559 | 3.582 | 3.606 | 3.630 | 3.654 | 3.678 | 3.702 |
| Woodie | 3.240 | 3.340 | 3.500 | 3.600 | 3.760 | 3.860 | 4.020 |
| Fibonacci | 3.330 | 3.429 | 3.491 | 3.590 | 3.689 | 3.751 | 3.850 |
| Pivot points | S3 | S2 | S1 | PP | R1 | R2 | R3 |
|---|---|---|---|---|---|---|---|
| Standard | 2.397 | 2.903 | 3.267 | 3.773 | 4.137 | 4.643 | 5.007 |
| Camarilla | 3.391 | 3.471 | 3.550 | 3.630 | 3.710 | 3.790 | 3.869 |
| Woodie | 2.325 | 2.868 | 3.195 | 3.738 | 4.065 | 4.608 | 4.935 |
| Fibonacci | 2.903 | 3.236 | 3.441 | 3.773 | 4.106 | 4.311 | 4.643 |
Numerical data
The following is the status of the technical indicators and moving averages at the time of publication of this technical analysis:
| RSI (14): | 78.33 | |
| MACD (12,26,9): | 0.0460 | |
| Directional Movement: | 43.119 | |
| AROON (14): | 64.286 | |
| DEMA (21): | 3.689 | |
| Parabolic SAR (0,02-0,02-0,2): | 3.560 | |
| Elder Ray (13): | 0.280 | |
| Super Trend (3,10): | 3.683 | |
| Zig ZAG (10): | 4.090 | |
| VORTEX (21): | 1.0320 | |
| Stochastique (14,3,5): | 51.39 | |
| TEMA (21): | 3.740 | |
| Williams %R (14): | 0.00 | |
| Chande Momentum Oscillator (20): | 0.460 | |
| Repulse (5,40,3): | 10.9040 | |
| ROCnROLL: | 1 | |
| TRIX (15,9): | 0.0950 | |
| Courbe Coppock: | 4.41 |
| MA7: | 3.656 | |
| MA20: | 3.800 | |
| MA50: | 3.984 | |
| MA100: | 4.591 | |
| MAexp7: | 3.735 | |
| MAexp20: | 3.635 | |
| MAexp50: | 3.614 | |
| MAexp100: | 3.667 | |
| Price / MA7: | +12.14% | |
| Price / MA20: | +7.89% | |
| Price / MA50: | +2.91% | |
| Price / MA100: | -10.69% | |
| Price / MAexp7: | +9.77% | |
| Price / MAexp20: | +12.79% | |
| Price / MAexp50: | +13.45% | |
| Price / MAexp100: | +11.81% |
News
Don't forget to follow the news on VALBIOTIS. At the time of publication of this analysis, the latest news was as follows:
- Valbiotis to launch its 100% natural dietary supplement for the management of hypercholesterolemia on the French market in May
- Valbiotis presents its 2024 financial communication calendar
- Valbiotis sets out its commercial and clinical roadmap for 2024
- Valbiotis announces the success of its €15 M capital increase
- Valbiotis announces the launch of a capital increase
About author

Online


Add a comment
Comments
0 comments on the analysis VALBIOTIS - 1H